|
News: Tropical Cyclone Carlos
|
 |
|
Tropical Cyclone Carlos
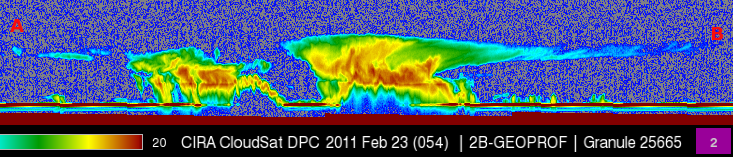
CloudSat overpassed Tropical Cyclone Carlos (located off the northwest coast of Australia in this overpass) on February 23, 2011 at 1800 UTC with winds of 55 knots (tropical storm strength). Carlos maintained a consistent intensity of 50-65 knots as it traveled along Australia's coast February 21-25 bringing heavy rainfall to some areas.
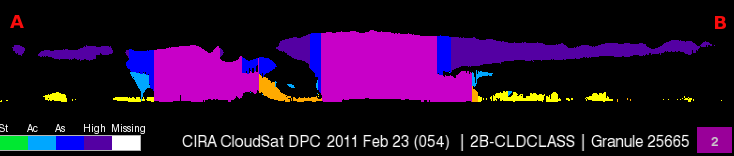
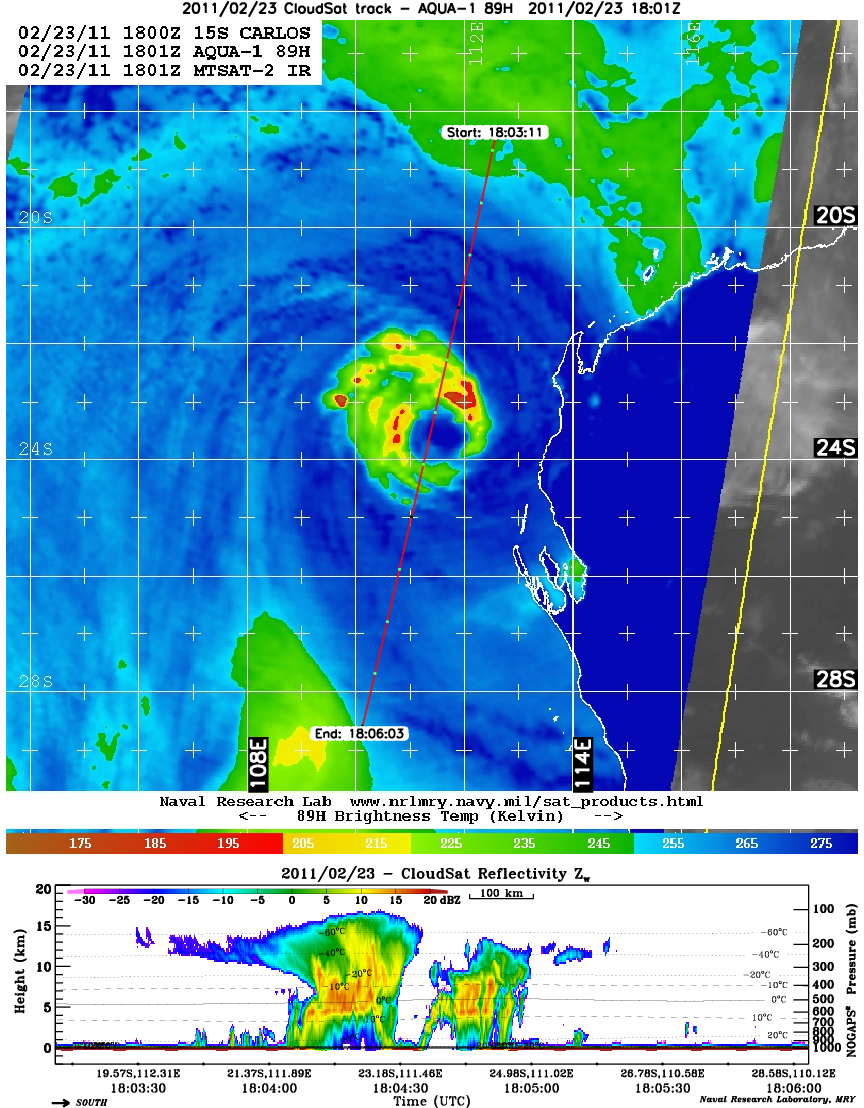
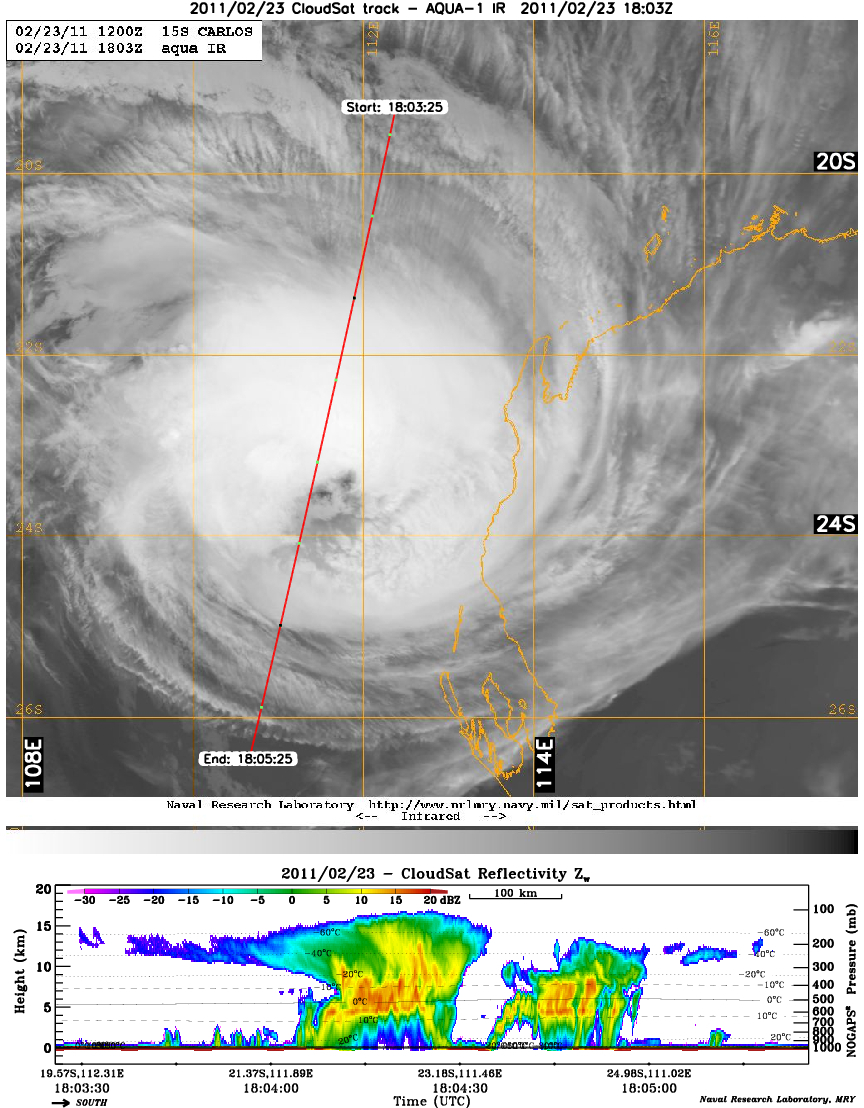
CloudSat passes right through the center (eye) of the storm. MODIS infrared (IR) imagery reveals darker, lower level clouds over most of the eye area and brighter, whiter cloud tops in the deeper convection of the eyewall area. AMSR-E imagery shows the outline of the eye area exceptionally well (image courtesy of NRL). AMSR-E imagery distinguishes the brightness temperature of the clouds, cloud top temperatures of deeper convection are colder as the clouds ascend further into the atmosphere. Deepest convection is located in the west and northeast bands of the eyewall. The CloudSat cross section reveals the tilted shape of the eyewall, the northern band slopes inward with vertical height and southern section of the eye contains multiple cloud layers - shallow cumulus at the surface and a mixture altostratus (AS) and altrocumulus (AC) producing a ragged appearance of the eye. Cloud top heights are higher with the deeper convection in the northern section and shallower with the lighter convection on the southern side. Carlos is gradually decreasing in intensity as sea surface temperatures decrease as the storm moves southwesterly along the coast of Australia.
The two bottom images below from NRL show the IR imagery from the satellite AQUA and AMSR-E imagery including the correspondingCloudSat overpass cross section below. Carlos brought heavy rains as it traveled along the coast and even broke rainfall records in Darwin.

References:
|


