|
News: Pakistan Flood 2010
|
 |
|
Floods in Pakistan - July/August 2010
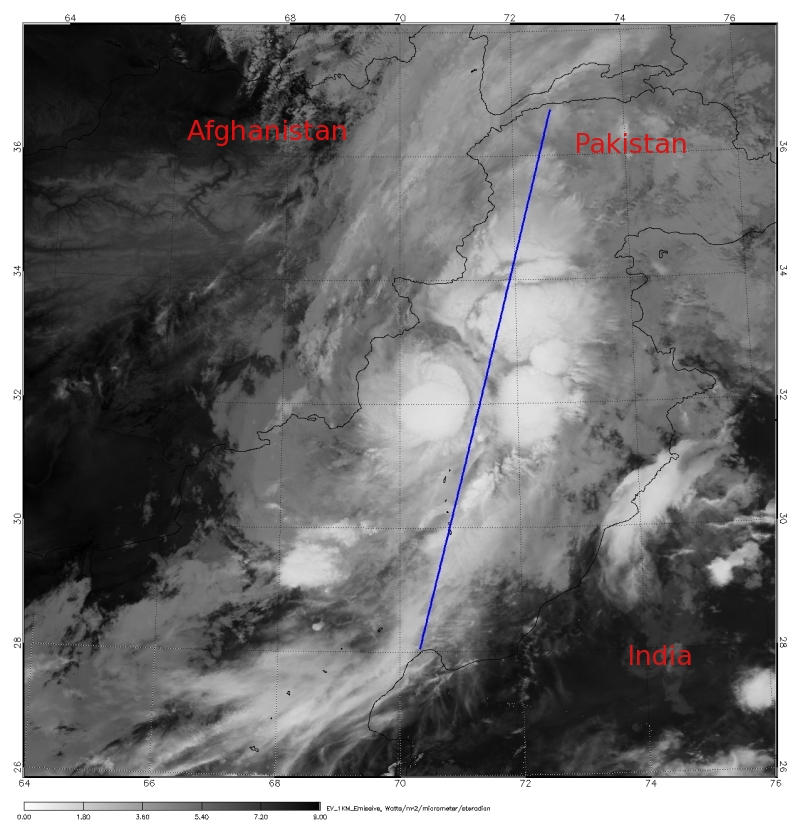
CloudSat overpassed an area of intense thunderstorms over central Pakistan on July 28, 2010. These particular storms cells of heavy rainfall are the beginning of the tragic and devastating flooding thats has afflicted millions of people throughout Pakistan. Rainfall rates were estimated at 400mm (16") from these cells between July 28-29 triggering flooding along the Indus and Kabul rivers.
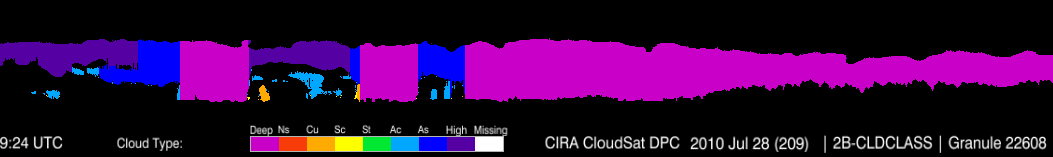
The satellite cut through a large thunderstorm cell in the northern section of the country. MODIS imagery reveals the bright white cloud tops from the clusters of thunderstorms (CloudSat path is noted by the blue line). CloudSat identifies a majority of the clouds as deep convective (cumulonimbus) cloud types, typical of thunderstorms (2B-CLDCLASS granule). The 2B-GEOPROF granule reveals the heavy precipitation associated throughout this storm cell. The CPR signal attenuates significantly directly below the melting layer through the heaviest precipitation and the ground echo completely disappears (middle of the image). The CPR attenuates (signal dampens) due to larger sized particles and heavy rains that are indistinguishable to the radar thus decreasing the reflectivity values.
Rainfall rates decrease north of the area as signal attenuation subsides and the ground echo from the topography becomes visible again (dark red line). Cloud top heights hover around 15 km in the deepest convection. Storms with similar structure have become common this summer as tropical monsoon moisture coupled with a strengthening La Nina dominate this areas weather patterns.

Sources:
|


