|
News: Typhoon Noul
|
 |
|
Typhoon Noul
CloudSat overpassed Typhoon Noul in the West Pacific on May 8, 2015 at 0457 UTC with estimated maximum strength winds of 100 knots (115 mph) and an estimated minimum pressure of 948mb.
The Moderate Resolution Imaging Spectroradiometer (MODIS) on NASA's Aqua satellite captured the infrared (IR) image taken a few minutes before the CloudSat overpass (the blue line A-> B on Figures 1 and 2). Figure 2 from MTSTAT, 4km remapped and color enhanced infrared (IR) imagery reveals the cold cloud tops surrounding the center of the storm. CloudSat overpassed east of the storm center through an area of deep convection.
At the time of the CloudSat overpass, Typhoon Noul was classified as very strong typhoon with 100 knots maximum wind speed. CloudSat reveals the upper level convective cloud tops from the radial outflow of the system. Note the base of the mid and upper level outflow starts around 7 km in vertical height in the middle of the CloudSat overpass (Figure 3). Underneath the deep mid and upper layer outflow, lower level cloud types are revealed (cumulus and cumulonimbus cells). A developing cell in an area north of the system (by the letter A) reveals moderate precipitation and larger amounts of liquid and ice water.
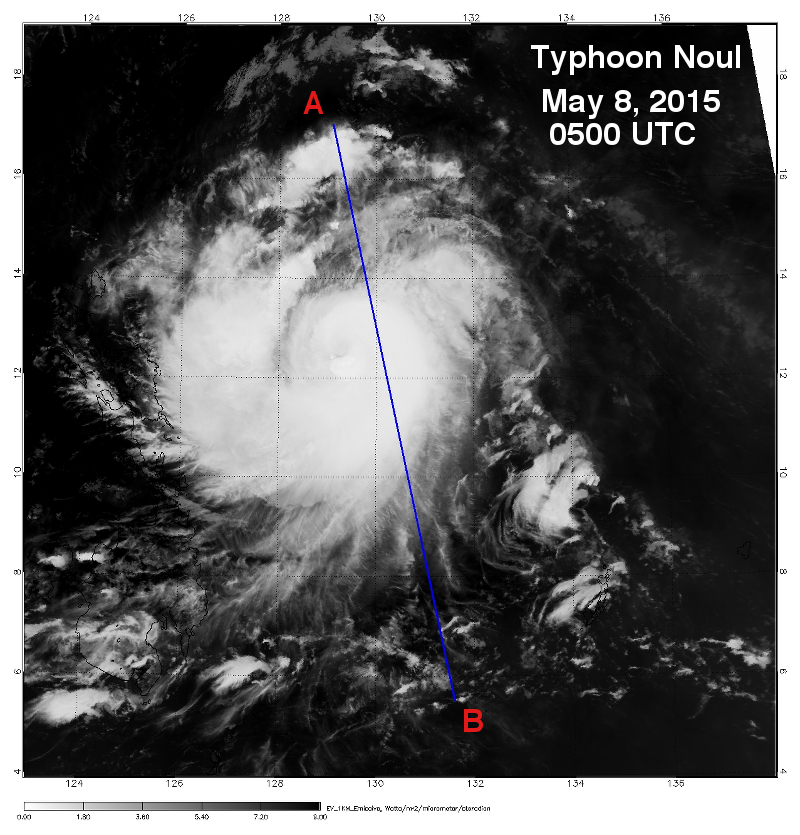
Figure 1. MODIS imagery of Typhoon Noul.

Figure 2. 4km Remapped Color Enhanced Infrared Imagery (courtesy RAMMB).
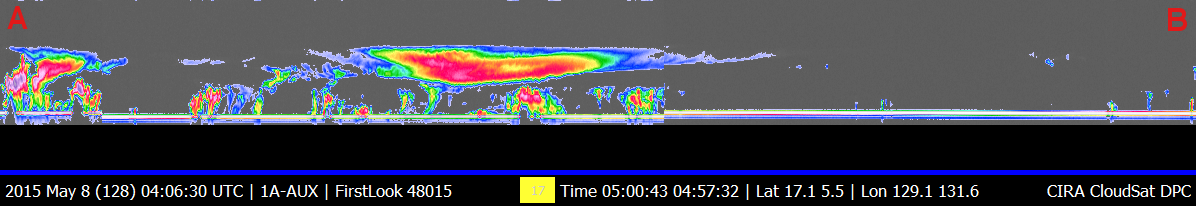
Figure 3. CloudSat overpass.
References:
MODIS imagery, LAADS Web, Retrieved May 10, 2015.
4km Remapped Color Enhanced Infrared Imagery, Typhoon Noul, Retrieved May 11, 2015.
CloudSat Data Processing Center, Retrieved May 09, 2015
NRL Tropical Cyclone Page, Typhoon Noul, Retrieved May 11, 2015.
Last Updated: Natalie D. Tourville, May 11, 2015.
|