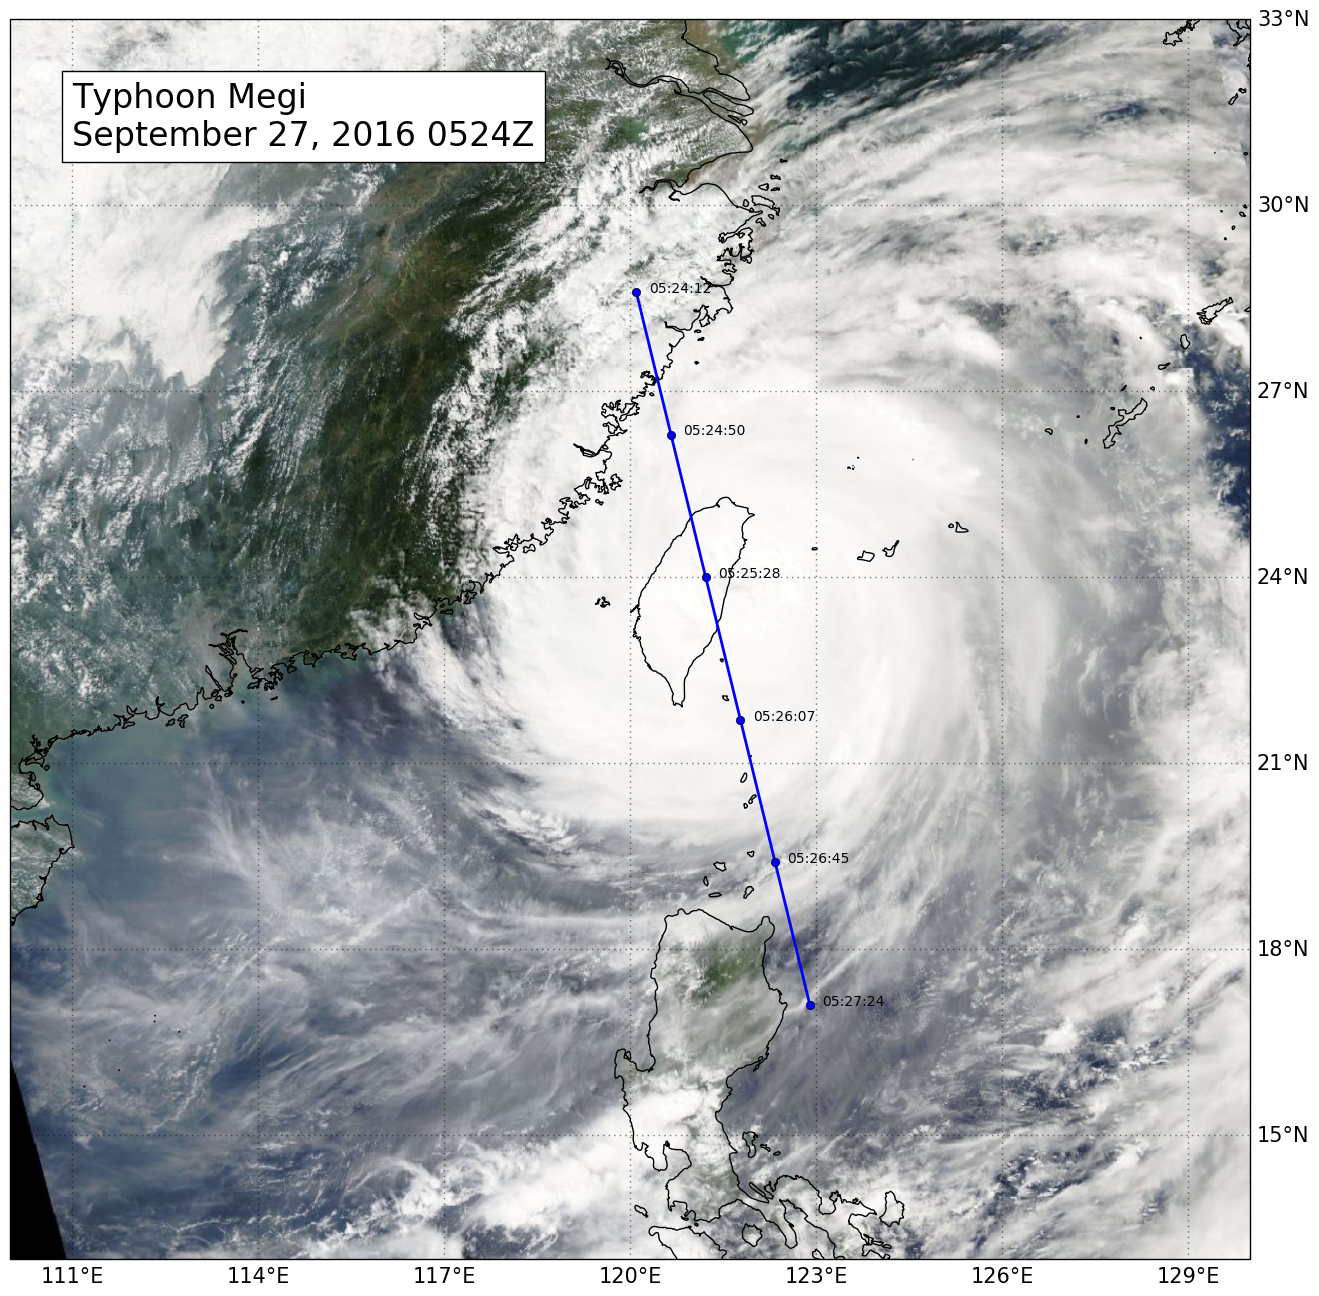
CloudSat completed an overpass of Typhoon Megi on September 27, 2016 @ 0524Z as the storm was moving over Taiwan. The system contained sustained winds of 100 knots with a minimum pressure of 948 mb.
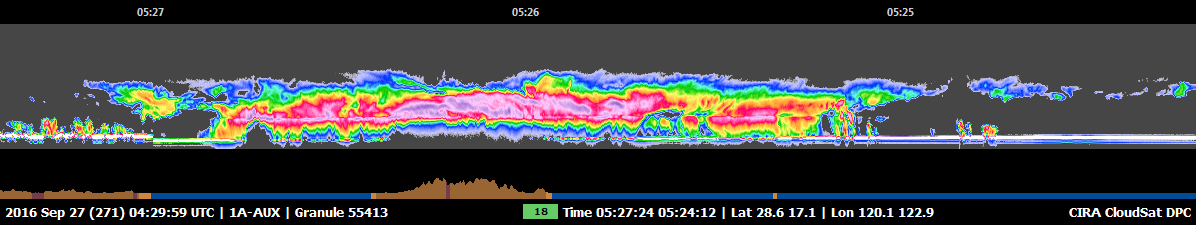
CloudSat overpassed just to the west of the storm center and reveals an extended region of moderate to heavy precipitation throughout the storm system. Large amount of liquid and ice water (denoted by the red and pink colors) are found beneath the cloud tops. The lack of signal (attenuation) can be seen in the heavier areas of precipitation as CloudSat's cloud profiling radar signal dampens when particles are larger than 3mm.
CloudSat likely overpassed through the eyewall of the system as revealed through the visible and infrared imagery (Figures 1, 3 and 5). The CloudSat overpass area colocated to this is right before the 05:26 timestamp as the system was located over Taiwan (Figure 2). This eyewall area lacks smaller cloud particles (areas of green and blue) at cloud top with lower cloud top heights than the surrounding areas.
The Moderate Resolution Imaging Spectroradiometer (MODIS) on NASA's Aqua satellite captured the infrared (IR) image taken a few minutes before the CloudSat overpass (the blue line on Figure 1). Figure 2 depicts the CloudSat 1B-CPR imagery of the overpass. Figure 3 is a time lapsed animation combining MTSAT imagery and the CloudSat overpass. Figure 4 merges MTSAT and CloudSat imagery into a 2D image. Figure 5 is the 4km remapped color enhanced infrared imagery with the CloudSat track (black line) courtesy of CIRA RAMMB.
Figure 1. MODIS imagery with CloudSat track and UTC time (blue line) of Typhoon Megi.
Figure 2. CloudSat 1B-CPR imagery of Typhoon Megi.
Figure 3. Typhoon Megi Animation - West Pacific, September 27, 2016.
Figure 4. MTSAT and CloudSat imagery of Typhoon Megi.
Figure 5. 4km Remapped Color Enhanced Infrared Imagery (courtesy RAMMB).
References:
MODIS imagery, NASA WorldView, Retrieved September 27, 2016.