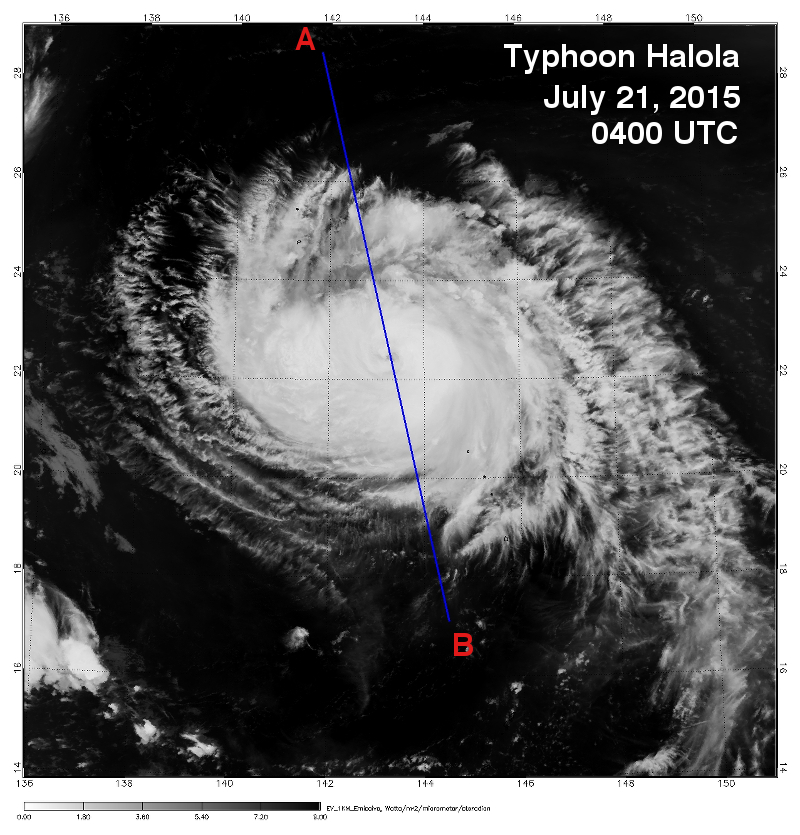
CloudSat completed an eye overpass of Typhoon Halola in the central Pacific on July 21, 2015 at 0400 UTC. Typhoon Halola contained estimated maximum winds of 64 knots (74 mph) and minimum pressure of 976 hPa (equivalent to a category 1 strength hurricane). Typhoon Halola was designated a storm on July 13, quickly strengthened into a typhoon and weakened shortly after. As the storm traversed across the Pacific Ocean it has restrengthened into a Typhoon as of July 21, 2015.
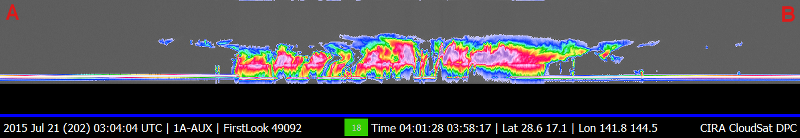
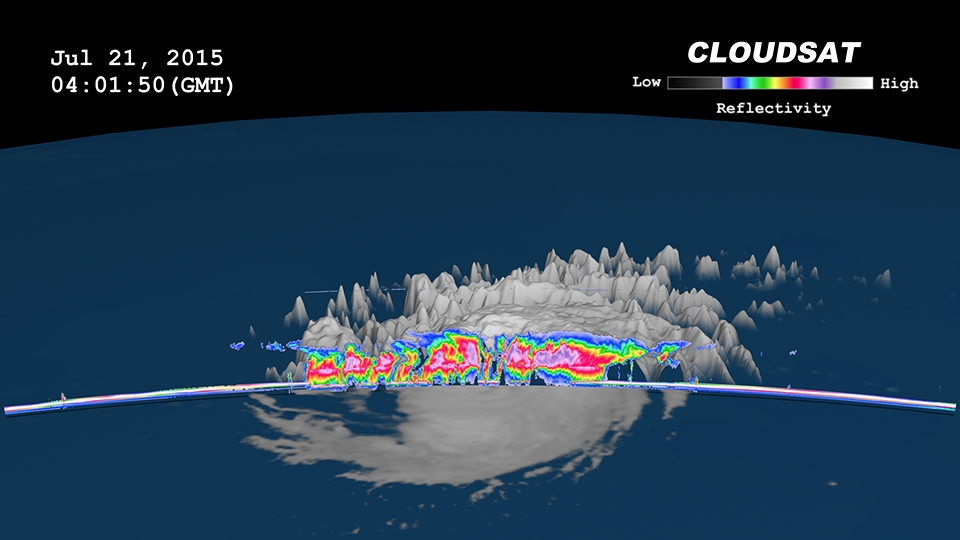
The Moderate Resolution Imaging Spectroradiometer (MODIS) on NASA's Aqua satellite captured the infrared (IR) image taken a few minutes before the CloudSat overpass (the blue line A-> B on Figures 1 and 2). Figure 2 from AQUA, 1km remapped and color enhanced infrared (IR) imagery reveals the cold cloud tops surrounding the center of the storm. Figure 3 depicts the CloudSat 1B-CPR imagery of the overpass. Figure 4 is a time lapsed animation combining Multifunctional Transport Satellite (MTSAT) imagery and the CloudSat overpass. Figure 5 combines MTSAT and CloudSat imagery into a 2D image.
At the time of the CloudSat overpass, an eye was starting to form as the storm started to organize and strengthen as conditions became favorable for storm development. The CloudSat overpass reveals a small area in the center of the overpass starting to become cloud free but is still covered with cirrus at the top of the storm. Cloud top heights average 15-16 km and areas of pink and red designate larger amounts of liquid and ice (Figure 3).
Figure 1. MODIS imagery with CloudSat track (blue line A->B) of Typhoon Halola.
Figure 2. 1km Remapped Color Enhanced Infrared Imagery (courtesy RAMMB).
Figure 3. CloudSat 1B-CPR imagery of Typhoon Halola.