|
News: Tropical Cyclone Haruna
|
 |
|
Tropical Cyclone Haruna
CloudSat overpassed Tropical Cyclone Haruna in the Mozambique channel (between Madagascar and Africa) on February 20, 2013 at 1115 UTC. Haruna contained maximum sustained winds of around 70 knots (80.5 mph) at the time of the overpass (a category 1 tropical strength system). CloudSat passed just to the west of the storm center (around 70 km outisde of the eye center) through an area of deep convection. This area of deep convection contains heavy precipitation and large amounts of water/ice content (the deep reds and pink colors show higher reflectivity -> larger sized water/ice droplets).
The Moderate Resolution Imaging Spectroradiometer (MODIS) on NASA's Aqua satellite captured the infrared (IR) (Figure 1) image taken a few minutes before the CloudSat overpass (Figure 2) denoted by the blue line A->B.
Tropical Cyclone Haruna was drifting slowly eastward toward Madagascar. CloudSat reveals the cirrus canopy over the northeast portion of the overpass and reveals areas of precipitation. Moderate to heavy precipitation is indicated by the lack of signal (attenuation) in the lowest levels of the CloudSat overpass. CloudSat reveals the cirrus canopy extending northeast towards Africa and shows areas of different cloud heights beneath the cirrus layer. The melting layer (an area of where ice changes to liquid water) is evident around 5 km in height by a distinct vertical line in the CloudSat overpass (Figure 2).
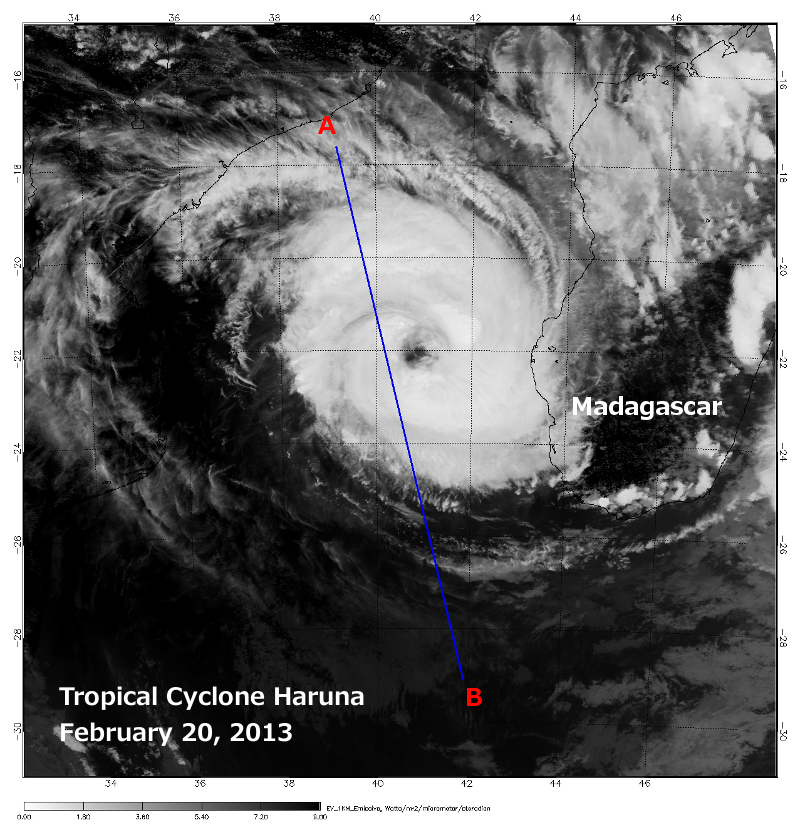 Figure 1. MODIS IR imagery with CloudSat track (blue). (courtesy NOAA LAADS Web) Figure 1. MODIS IR imagery with CloudSat track (blue). (courtesy NOAA LAADS Web)
 Figure 2. CloudSat overpass track (courtesy CloudSat Data Processing Center) Figure 2. CloudSat overpass track (courtesy CloudSat Data Processing Center)
References:
JTWC - http://www.usno.navy.mil/JTWC/, Retrieved Febraury 22, 2013.
MODIS imagery, LAADS Web, Retrieved February 22, 2013.
Regional and Mesoscale Meteorology Branch (RAMMB) - Tropical Cyclone Haruna
Last updated: February 22, 2013 by Natalie D. Tourville
|


