|
News: Tropical Cyclone Fantala
|
 |
|
Tropical Cyclone Fantala
CloudSat completed an overpass of Tropical Cyclone Atsani in the Indian Ocean on April 15, 2016 @ 0953 UTC. Tropical Cyclone (TC) Fantala contained estimated maximum winds of 112 knots (129 mph) and minimum pressure of 939 hPa (equivalent to a category 3 strength hurricane). Typhoon Fantala was undergoing a period of strengthening at this time.
The Moderate Resolution Imaging Spectroradiometer (MODIS) on NASA's Aqua satellite captured the infrared (IR) image taken a few minutes before the CloudSat overpass (the blue line A-> B on Figures 1 and 2). Figure 2 from AQUA, 4km remapped and color enhanced infrared (IR) imagery reveals the cold cloud tops surrounding the center of the storm. Figure 3 depicts the CloudSat 1B-CPR imagery of the overpass.
CloudSat's 94 GHz cloud profiling radar (CPR) overpassed east of the center of TC Fantala. The CloudSat overpass (Figure 3) reveals the various cloud structures in the system such as large cirrus anvil, smaller convective cells and deeper convective cells south of the eye (cloud heights are taller). The CloudSat CPR signal attenuates in very heavy rainfall when cloud droplets become larger than 3 mm and dampens the strength of the CPR signal, this is evident by the lack of signal towards the surface. Large amounts of ice and water are found in taller convective cells (pink and red colors).
TC Fantala made history as the strongest storm system (since 1990) in the Indian Ocean. The system formed April 11, 2016 and dissipated April 24, 2016.
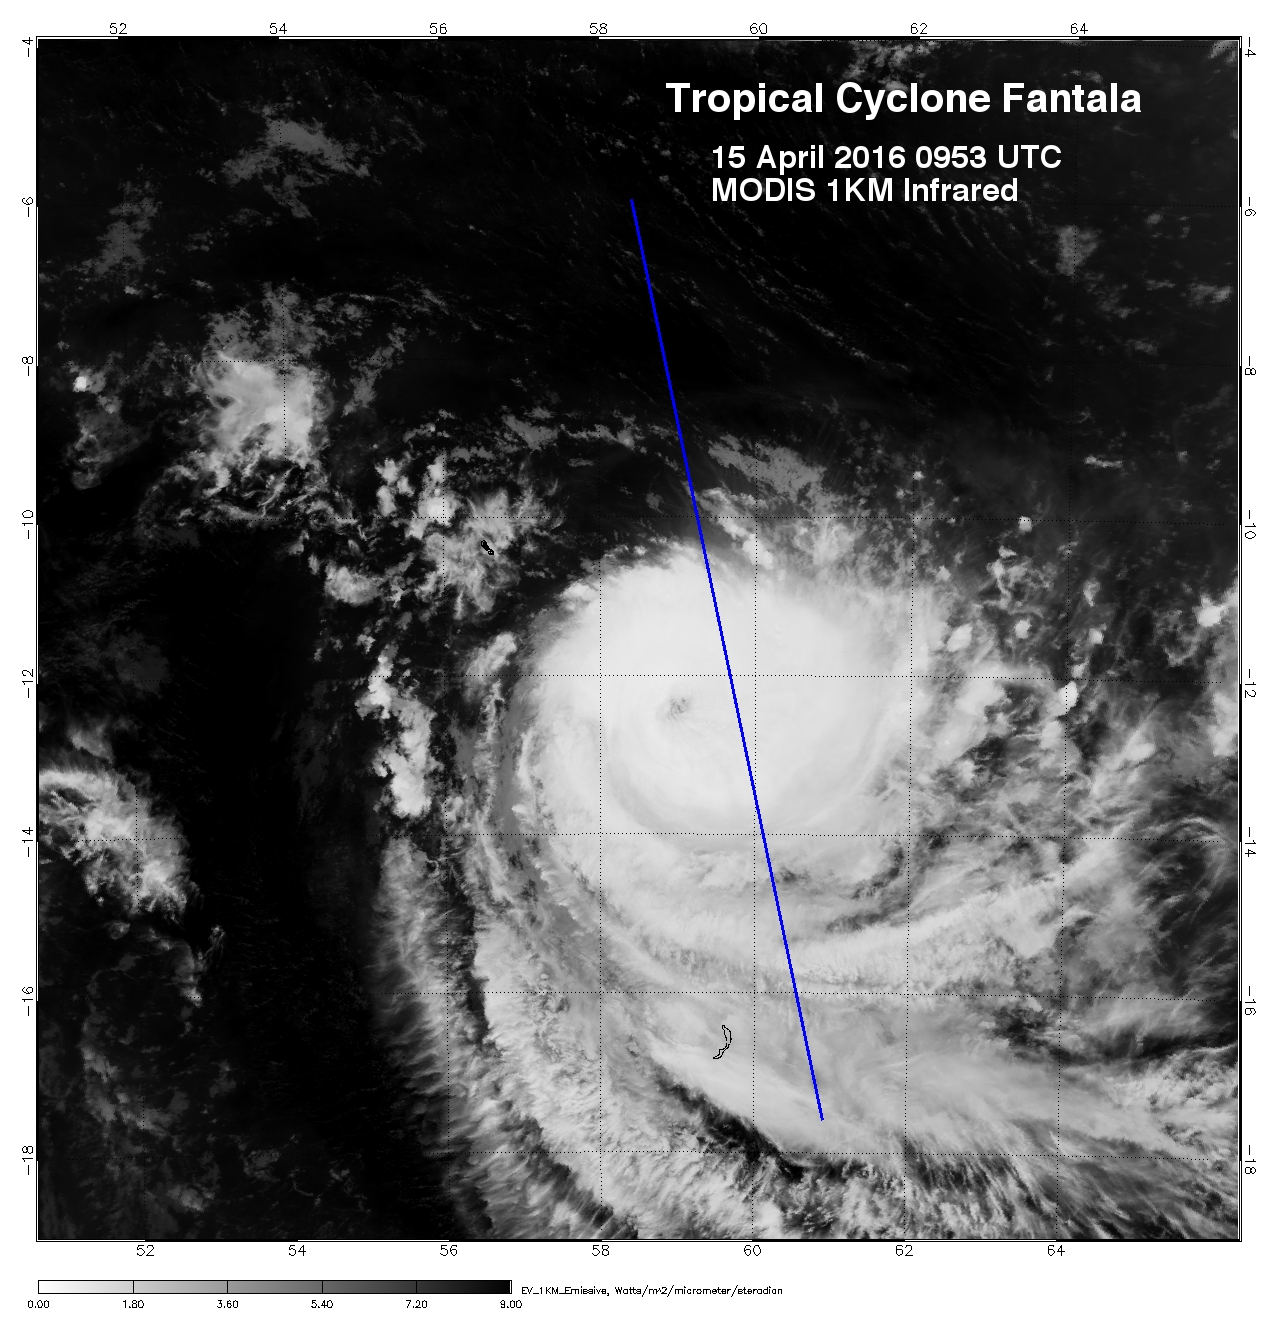
Figure 1. MODIS imagery with CloudSat track (blue line A->B) of Tropical Cyclone Fantala.
Figure 2. 4km Remapped Color Enhanced Infrared Imagery (courtesy RAMMB) with CloudSat track in blue.
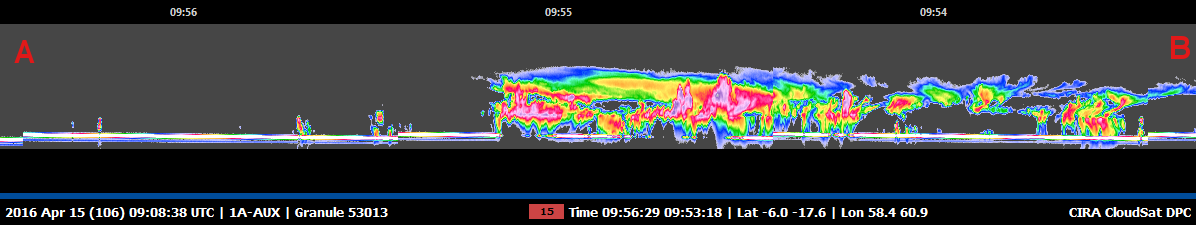
Figure 3. CloudSat 1B-CPR imagery of Tropical Cyclone Fantala.
References:
MODIS imagery, LAADS Web, Retrieved April 20, 2016.
4km Remapped Color Enhanced Infrared Imagery, Typhoon Atsani, Retrieved April 20, 2016.
CloudSat Data Processing Center, Retrieved April 20, 2016.
NRL Tropical Cyclone Page, Typhoon Atsani, Retrieved April 20, 2016.
Last Updated: Natalie D. Tourville, April 29, 2016.
|


