|
News: Tropical Cyclone Bansi
|
 |
|
Tropical Cyclone Bansi
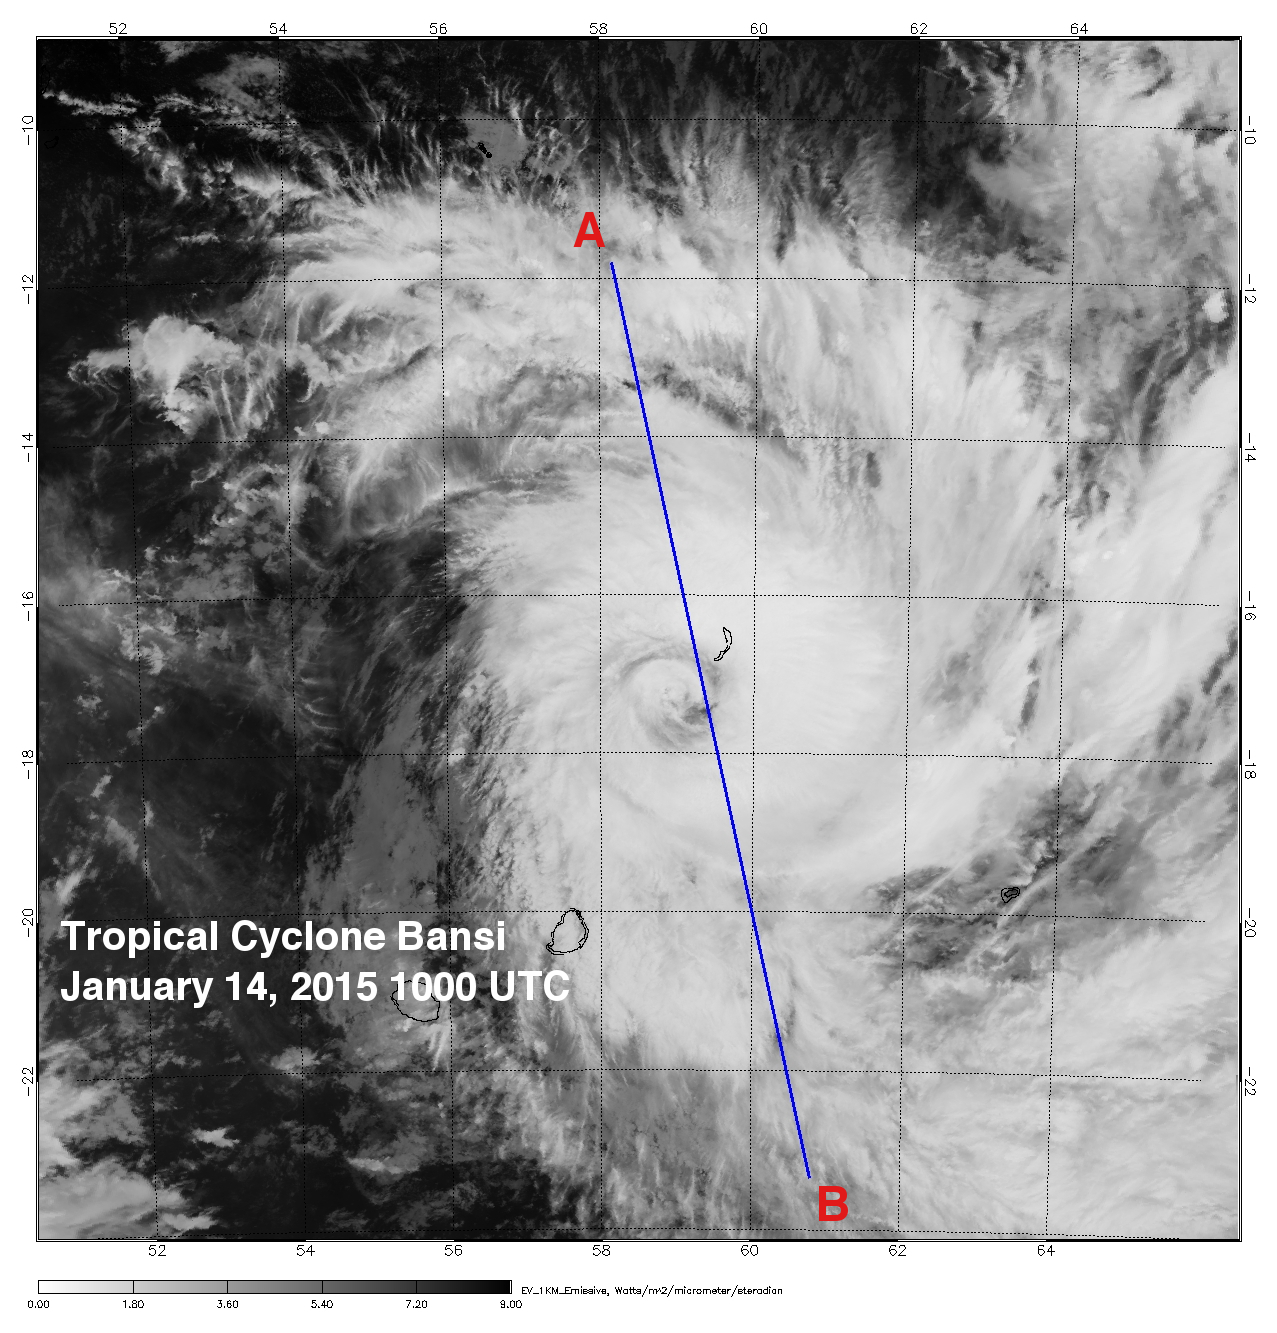
CloudSat overpassed Tropical Cyclone Bansi on January 14, 2015 at 1000 UTC in the southwest Indian Ocean. TC Bansi contained maximum sustained winds of around 90 knots at the time of the overpass. CloudSat passed directly over the eastern section of the large eye of the storm revealing the structure of eye and surrounding eye wall convection. CloudSat vertical profile details the thin cirrus above the eye and eyewall outward curve from the ocean surface to the top of the storm. Heavy rainfall in the eyewall and surrounding rainbands (denoted by attenuation or lack of signal in the lowest 5-6 km of the overpass).
Areas of deep convection contains heavy precipitation and large amounts of water/ice content (the deep reds and pink colors show higher reflectivity -> larger sized water/ice droplets).
The Moderate Resolution Imaging Spectroradiometer (MODIS) on NASA's Aqua satellite captured the infrared (IR) (Figure 1) image taken a few minutes before the CloudSat overpass (Figure 2) denoted by the blue line A->B.
Tropical Cyclone Bansi was stationary in the Indian Ocean during this overpass. CloudSat reveals the cirrus canopy over the northern portion of the overpass and a large swath of moderate to heavy precipitation. Moderate to heavy precipitation is indicated by the lack of signal (attenuation) in the lowest levels of the CloudSat overpass. The melting layer (an area of where ice changes to liquid water) is evident around 5 km in height by a distinct vertical line in the CloudSat overpass (Figure 2).
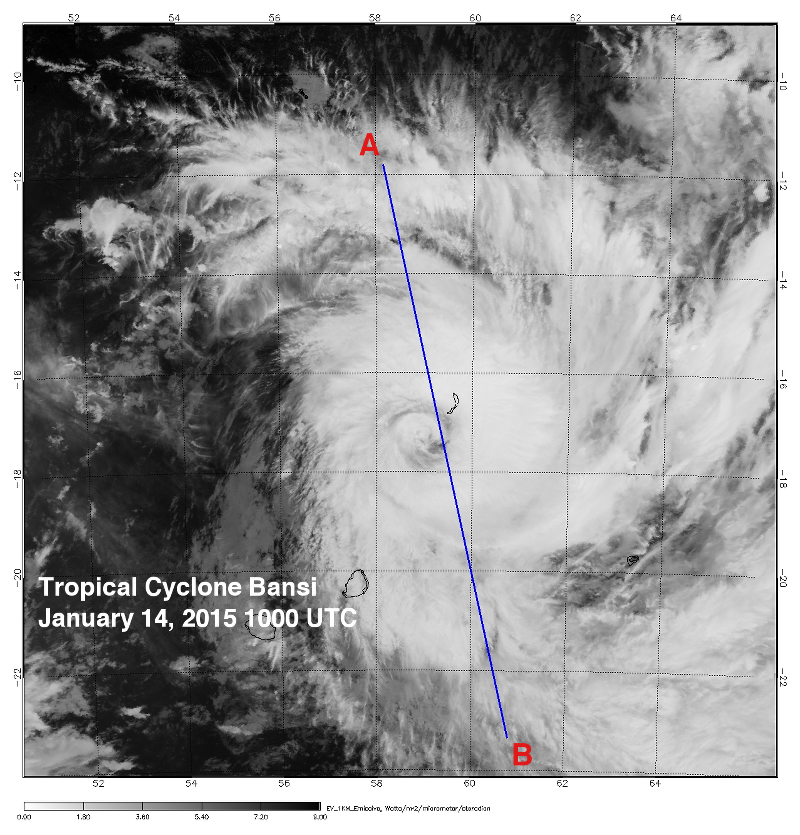 Figure 1. MODIS IR imagery with CloudSat track (blue). (courtesy NOAA LAADS Web) Figure 1. MODIS IR imagery with CloudSat track (blue). (courtesy NOAA LAADS Web)
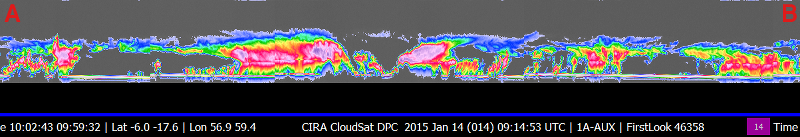 Figure 2. CloudSat overpass track (courtesy CloudSat Data Processing Center) Figure 2. CloudSat overpass track (courtesy CloudSat Data Processing Center)
References:
MODIS imagery, LAADS Web, Retrieved February 25, 2015.
Regional and Mesoscale Meteorology Branch (RAMMB) - Tropical Cyclone Bansi
Last updated: February 26, 2015 by Natalie D. Tourville
|