iCloudSat completed an overpass of Typhoon Meranti on September 13, 2016 @ 0512Z as the storm was approaching Taiwan. The system contained sustained winds of 160 knots with a minimum pressure of 898 mb designating this system as a ’Super Typhoon’.
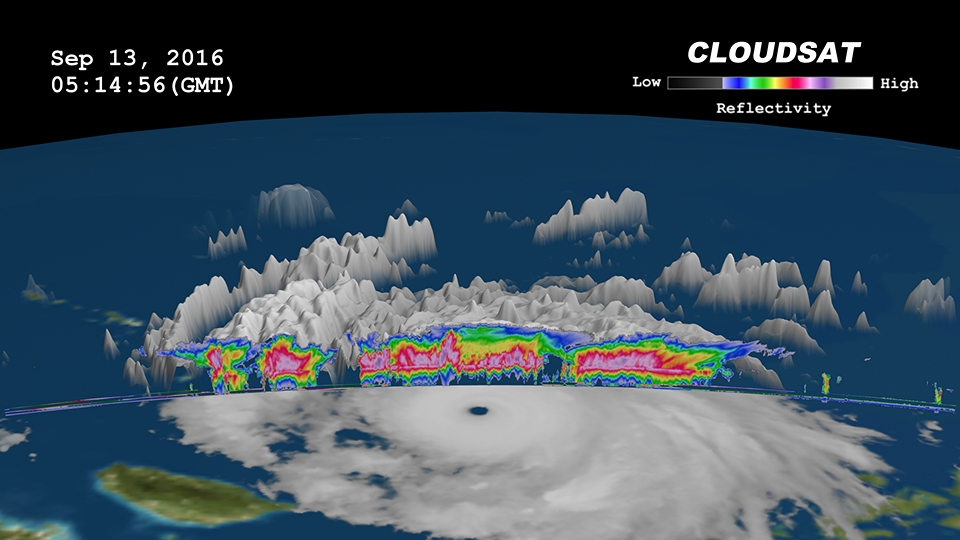
The CloudSat overpass reveals the inner details beneath the cloud tops of this large system; intense areas of convection with heavy rainfall (deep red and pink colors), cloud-free areas (moats) in between the inner and outer cloud bands of the typhoon and cloud top height’s averaging around 16 km. Lower values of reflectivity (areas of green and blue) denote smaller ice and water particle sizes typically located at top of the system (in the anvil area).
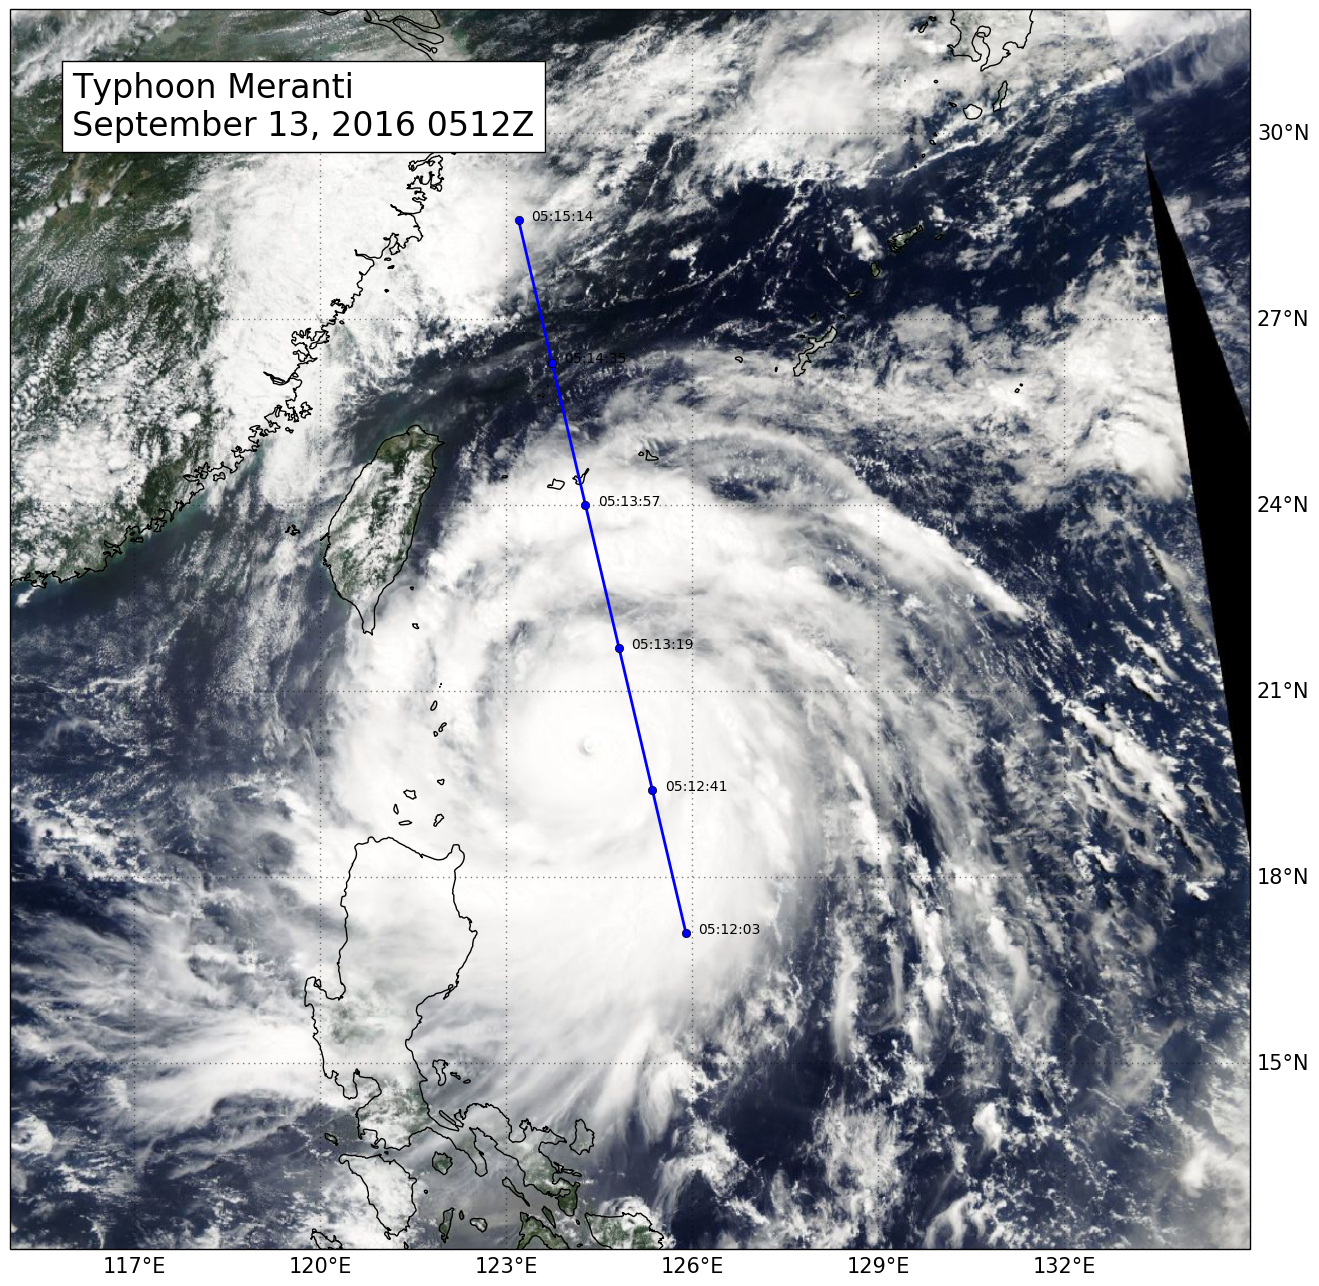
The Moderate Resolution Imaging Spectroradiometer (MODIS) on NASA's Aqua satellite captured the infrared (IR) image taken a few minutes before the CloudSat overpass (the blue line on Figure 1). Figure 2 depicts the CloudSat 1B-CPR imagery of the overpass. Figure 3 is a time lapsed animation combing MTSTAT imagery and the CloudSat overpass. Figure 4 combines MTSTAT and CloudSat imagery into a 2D image.
Figure 1. MODIS imagery with CloudSat track (blue line A->B) of Typhoon Meranti.
Figure 2. CloudSat 1B-CPR imagery of Typhoon Meranti.