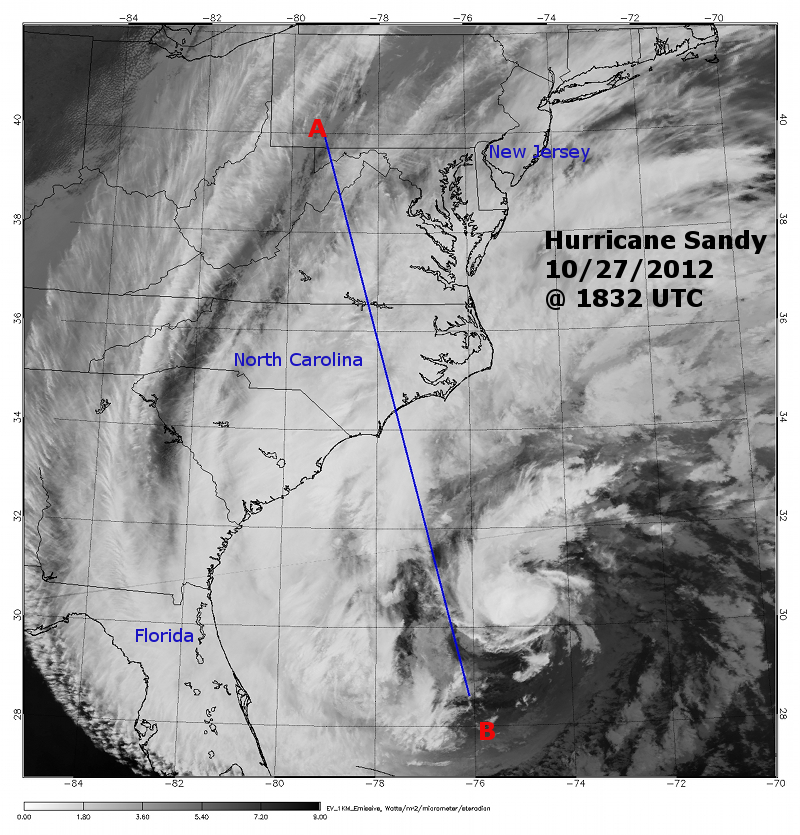
CloudSat overpassed Hurricane Sandy @ 1832 UTC (1432 EDT) on October 27, 2012 in the Atlantic Ocean, about 540 km southeast of Charleston, South Carolina. Maximum winds in Hurricane Sandy are estimated at 75 mph with a minimum pressure of 961 mb making this storm a Category 1 strength tropical system. Hurricane Sandy is moving slowly to the northeast at 11 mph almost parallel to the southeast United States coast and directly traversing the Gulf Stream.
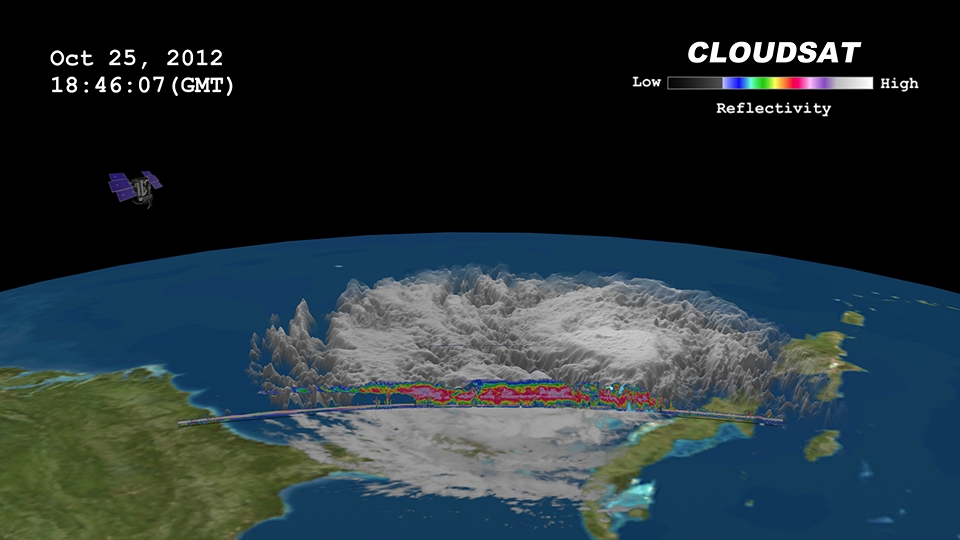
CloudSat overpassed just to the west of the inner core of the system (A -> B) (Figure 1). Light to moderate precipitation associated with parts of the outer bands of Hurricane Sandy are moving on shore into parts of North Carolina where CloudSat intersects the system (Figure 2). Heavier showers and thunderstorms are found further south and east of the Atlantic coastline over the open water (estimated ocean temperature is just over 27 degrees C). The CloudSat signal tends to attenuate or dampen in these areas of heavier convection when rain drops become larger than 3 mm in diameter. The cloud shield associated with Hurricane Sandy extends well over 1000 km from the storm center covering parts of eastern Kentucky and Tennessee and Virginia and West Virginia with mid and high level cloudiness (areas of cirrus (CI) and altocumulus (AC)).
An animation containing GOES satellite imagery with CloudSat imagery overlaid is shown in Figure 3, 4 and 5 (courtesy Shigeru Suzuki of JPL).
Sandy is forecasted to interact with short wave trough moving westward towards the northeast United States. Through baroclinic processes, the system will intensify slightly and transition to a strong extratropical (ET) system as Sandy moves northwest towards the Mid-Atlantic shoreline.
Figure 1. MODIS IR imagery (courtesy NOAA LAADS Web).
Figure 2. CloudSat overpass track (courtesy CloudSat Data Processing Center).
Figure 3. Hurricane Sandy - GOES Full Globe View.
Figure 4. CloudSat cross-section of Hurricane Sandy with GOES satellite imagery.