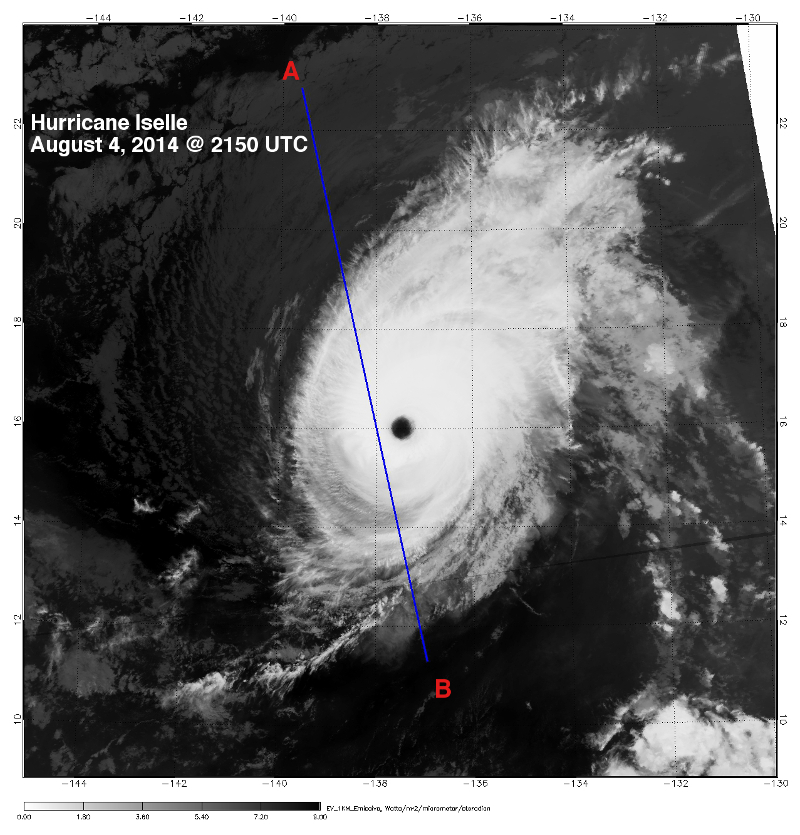
CloudSat overpassed Hurricane Iselle in the Pacific Ocean on August 4, 2014 at 2150 UTC. Iselle contained maximum sustained winds of 132 mph (115 knots) with a minimum central pressure of 951 mb. CloudSat overpassed just to the west of the center of compact storm intersecting the eyewall.
The Moderate Resolution Imaging Spectroradiometer (MODIS) on NASA's Aqua satellite captured the infrared (IR) (Figure 1) image taken a few minutes before the CloudSat overpass (Figure 2) denoted by the blue line A->B). The 1km Enhanced Infrared (IR) Imagery, Figure 3, also shows the CloudSat track during the same time period. This imagery distinguishes between cold and warm cloud top temperatures using IR imagery (higher cloud tops -> colder temperatures).
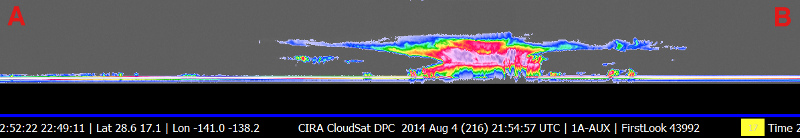
Hurricane Iselle was moving slowly westward towards Hawaii during the time of this overpass. The structure of Iselle is the classic annular structure with a well defined eye surrounded by a ring of deep convection. The CloudSat overpass (Figure 2) intersects this section of dense, convective cloud tops with cloud top heights around 15-16 km. The CloudSat cloud profiling signal attenuates in areas of moderate to heavy precipitation, quite evident from the convective cores in the CloudSat overpass. Cirrus cloud tops extend outwards from the storm to the northwest and southeast along the track of the descending CloudSat overpass.
An animation containing GOES satellite imagery with CloudSat imagery overlaid is shown in Figure 4 (courtesy Shigeru Suzuki of JPL).
Figure 1. MODIS IR imagery (courtesy NOAA LAADS Web).
Figure 2. CloudSat overpass track (courtesy CloudSat Data Processing Center).
Figure 3. 1km Remapped Color Enhanced Infrared Imagery (courtesy RAMMB).