CloudSat overpassed Tropical Storm Leslie in the Atlantic Ocean on August 31, 2012 at 1653 UTC (1253 EDT). Leslie contained maximum sustained winds of 65 mph with a minimum central pressure of 999 mb. CloudSat overpassed directly over a developing cumulonimbus cloud with an overshooting cloud top near the center of the storm.
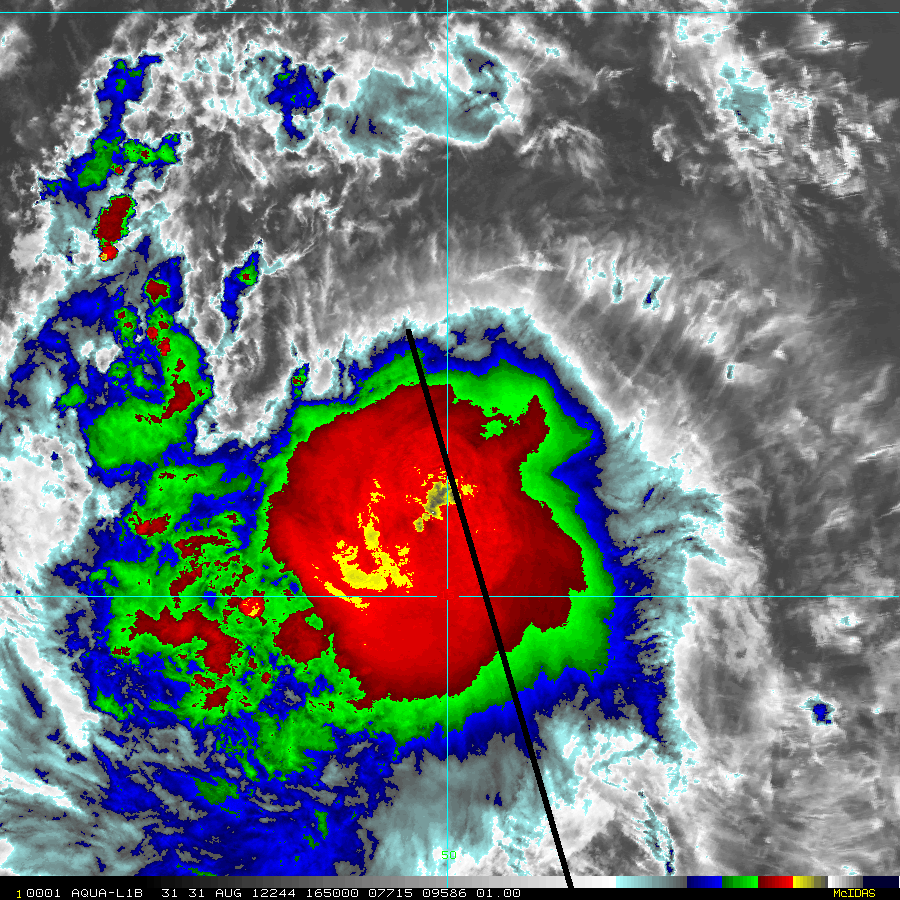
The Moderate Resolution Imaging Spectroradiometer (MODIS) on NASA's Aqua satellite captured the infrared (IR) (Figure 1) image taken a few minutes before the CloudSat overpass (Figure 2) denoted by the blue line A->B). The 1km Enhanced Infrared (IR) Imagery, Figure 3, also shows the CloudSat track during the same time period. This imagery distinguishes between cold and warm cloud top temperatures using IR imagery (higher cloud tops -> colder temperatures).
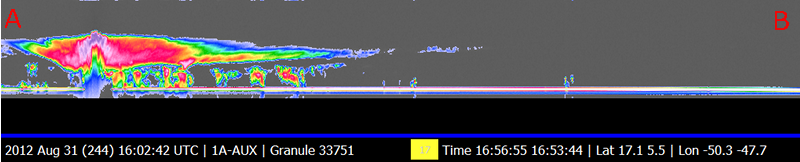
Tropical Storm Leslie was moving towards the NW and experiencing moderate shear from the NE (note the lack of cirrus canopy in NE portions of the storm). CloudSat overpassed an area of buoyant tropical convection associated with strong updrafts. The overpass reveals the overshooting cloud tops extending over 17 km into the atmosphere and penetrating the lower stratosphere. The CPR signal attenuates in areas of moderate and heavy rainfall, quite evident in the region of the overshooting cloud top.
An animation containing GOES satellite imagery with CloudSat imagery overlaid is shown in Figure 4 (courtesy Shigeru Suzuki of JPL).
Figure 1. MODIS IR imagery (courtesy NOAA LAADS Web).
Figure 2. CloudSat overpass track (courtesy CloudSat Data Processing Center).
Figure 3. 1km Remapped Color Enhanced Infrared Imagery (courtesy RAMMB).
Figure 4. Tropical Storm Leslie Animation - Gulf of Mexico, August 31, 2012.