|
|
 |
|
News: 2007
|
|
|
2007 CloudSat News
12 December 2007
-
CloudSat Principal investigator Graeme Stephens and scientists Jen Kay and John Haynes presented a press conference at the 2007 annual AGU conference. At the press conference, new discoveries regarding sea-ice extent sensitivity, global rainfall patterns, and aerosol effects, all using CloudSat observations, were unveiled. Download the press conference presentation here (MS PowerPoint file, 7.8 MB)
4 July 2007
-
On July 4 CloudSat executed a maneuver designed to avoid a close approach with an Iranian satellite, SINAH 1. The close approach was predicted to occur on 6 July. CloudSat is a NASA satellite managed by the Jet Propulsion Laboratory (JPL) in Pasadena, CA and is operated by the U.S. Air Force Space Development and Test Wing (SDTW) at Kirtland Air Force Base, New Mexico. This was the first such "collision avoidance" maneuver by CloudSat in over a year of operation.
The close approach was first identified on July 1 during daily screening for any space objects predicted to come within one kilometer of CloudSat over the following five days. The predicted miss distance was about 100 meters. Based on uncertainties in the orbit predictions the probability of collision was estimated to be greater than 1 in 10000. CloudSat managers at JPL considered this sufficient risk to plan a maneuver while continuing to monitor the daily reports.
Orbit planners at SDTW advised JPL that CloudSat could be moved forward in its orbit about five kilometers over two days by firing thrusters to reduce CloudSat's speed by 1 centimeter per second. This would make the predicted closest approach with SINAH 1 over four kilometers, and eliminate the possibility of a collision. Doing the maneuver two days prior to the conjunction made it possible to generate the desired separation with a smaller maneuver and also allowed time to execute a back-up maneuver in case the planned one failed.
When the reports on July 2 and 3 also predicted miss distances around 100 meters, JPL gave the go ahead to execute the maneuver. The maneuver was executed early on July 4 and subsequent screening based on CloudSat's new orbit, determined from its on-board GPS, confirmed that the miss distance was over four kilometers.
CloudSat is part of a group of NASA satellites known as the Afternoon Constellation and maintains a separation of 75 to 112 kilometers with CALIPSO, its nearest neighbor in the constellation. The maneuver on July 4 was similar to the maneuvers CloudSat has conducted every few weeks in order to maintain this formation with CALIPSO. CloudSat conducted another maneuver on July 7, after the conjunction, to reverse the drift caused by the maneuver on July 4 and maintain the formation with CALIPSO.
26 June 2007
-
CloudSat is providing unique information about recent storms in Texas and Oklahoma (see CNN coverage of Texas flooding here). The images above were taken at 2000 UTC (3:00 PM CDT) on 26 June 2007. In the first image an obvious storm hangs over the middle of the United States. The second image is CloudSat data looking, in profile, at the clouds in this storm. The vertical axis represents the altitude from the ground to the top of the atmosphere. The variations of color intensity are differences in reflectivity and an indication of the differing amounts of water and ice in the storm clouds. The bright line at the bottom of the panel is the ground return from the radar. This indicates that the radar penetrated to the ground most of the time, even through heavy rainfall. Where the ground return disappears is an indication that the radar was attenuated by heavy precipitation, likely exceeding 30 mm/hr, based on previous studies. From one side to the other, the bottom panel is approximately 800 km, and the vertical scale from top to bottom is approximately 30 km. The CloudSat data provide analysts and forecasters with a view of storms never before available. Cross-sections like these provide a view of the internal structure of these storms, giving information about the intensity, rainfall rates, and cloud organization.
25-26 June 2007
-
A recent CNN article describes flooding and associated evacuations in the Baluchistan province of Pakistan on 25-26 June 2007. A CloudSat overpass of the region (image above; click to enlarge) shows an intense precipitation cell over the Arabian Sea off the south-west coast of Pakistan at 0918 UTC (2:18 PM local time) on 25 June.
4-11 June 2007
-
CloudSat's Cloud Profiling Radar collected a number of cross-sectional profiles of recent heavy tropical rains over China's southern coast. During the week of 4-11 June 2007, large areas on and near China's southern coast received up to 200 mm (8 inches) of rain, with some areas topping 500 mm (20 inches). (See article and rain map at NASA's Earth Observatory. The three images above (click to enlarge) show the evolution of the rain and cloud field, with the CloudSat ground track overlain on infrared satellite imagery on the left, together with a CloudSat Quicklook image (corresponding to the green segment of the displayed ground track) on the right. CloudSat Quicklook images are available here. The images show daytime segments of the orbit on 4, 9, and 11 June, with the satellite traveling northwest along the track on each day (right to left in the quicklook image). The coastline is marked by the transition of the topography plot from blue to brown (just above the text in the quicklook images).
9 May 2007
-
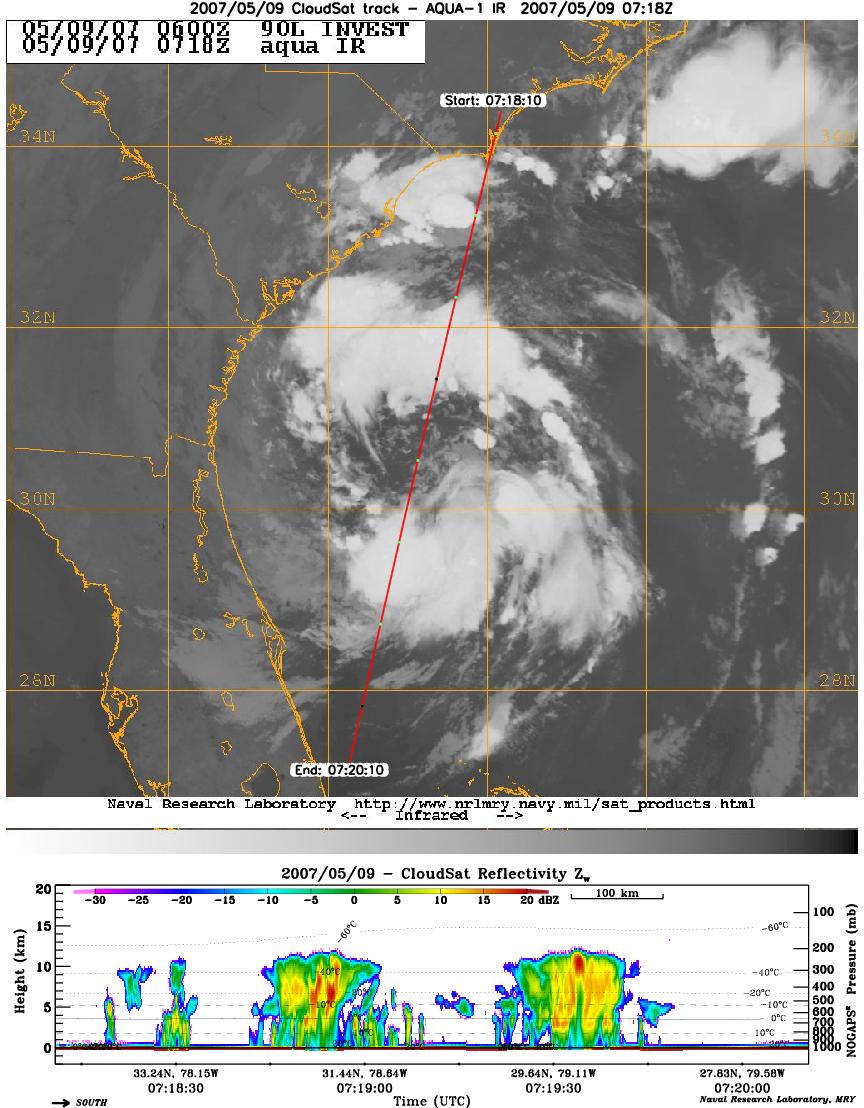
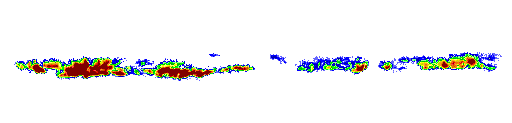
CloudSat's Cloud Profiling Radar captured a profile across Tropical Storm Andrea on Wednesday, 9 May 2007 near the SC/GA/FL Atlantic coast. The upper image shows an infrared view of TS Andrea from the MODIS instrument on the Aqua satellite, with CloudSat's ground track from 0718-0720 UTC (3:18-3:20 EDT) shown as a red line. The lower image is the vertical cross section of radar reflectivity along this path, where the colors indicate the intensity of the reflected radar energy. CloudSat orbits approximately one minute behind Aqua in a satellite formation known as the A-Train. [Images courtesy of the Naval Research Laboratory-Monterey]
28 April 2007
-
CloudSat Celebrates One Year in Orbit
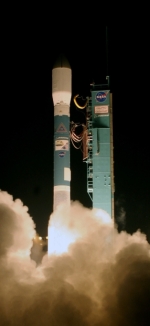 CloudSat, a satellite mission conceived by Colorado State University scientist Graeme Stephens, celebrated its first anniversary on Saturday, 28 April, as the world's most sensitive cloud-profiling radar in orbit.
Since launching into an orbit 705 km (438 miles) above Earth on 28 April 2006, CloudSat has made 5,307 orbits around the Earth, snapped 162 million vertical profiles of clouds and distributed more than 6 terabytes of data to the international science community, according to the Cooperative Institute for Research in the Atmosphere, or CIRA, which is based at Colorado State and is responsible for the satellite's data collection.
In this mission, Stephens, a University Distinguished Professor in atmospheric science, provides the scientific guidance and is responsible for the mission's success while NASA's Jet Propulsion Laboratory manages and implements the mission. CloudSat is one of only three principal investigator-led Earth science missions launched or about to be launched by NASA and is one of the very few Earth missions that has had such university leadership.
Other partners include Ball Aerospace and Technologies Corp., which built the spacecraft for the CloudSat mission, the U.S. Department of Energy, the U.S. Air Force, and the Canadian Space Agency.
CloudSat is the first radar to look vertically at the characteristics of clouds, particularly water and ice content that could someday help scientists better predict weather patterns and climate changes. Researchers around the world will benefit from the radar's data about cloud processes. In addition to improving weather forecasting, the data will help scientists understand how clouds determine Earth's energy balance, thus increasing the accuracy of severe storm warnings, improving water resource management, and developing more advanced radar technology.
During the expected 22-month duration of the mission, CIRA will process and store about 12 terabytes of data. A terabyte is one million megabytes - a megabyte has enough disk storage to hold about 20,000 average-sized e-mail messages.
The CloudSat spacecraft is flying in orbital formation as part of a constellation of satellites, including NASA's Aqua and Aura satellites, the French Space Agency (CNES) PARASOL satellite and the NASA-CNES CALIPSO satellite. This is the first time that five research satellites are flying together in formation.
Recent CloudSat news items:
16 April 2007
-
The CPR switched to Initialize Mode at 1016 UTC on 12 April 2007. Science data was not collected from this time until re-activation at 1529 UTC on 16 April 2007. This anomaly is of the same kind as the anomalies of 16 June and 17 July 2006.
21 March 2007
-
A commanding error at 2214 UTC on Saturday, 17 March 2007, caused the radar to be taken offline and the spacecraft to be transitioned to standby. Data collection resumed at 1429 UTC on Wednesday, 21 March.
5 March 2007
-
New and Improved CloudSat Tools Online
Several online tools for visualizing CloudSat data and ground tracks have been developed or improved in recent months.

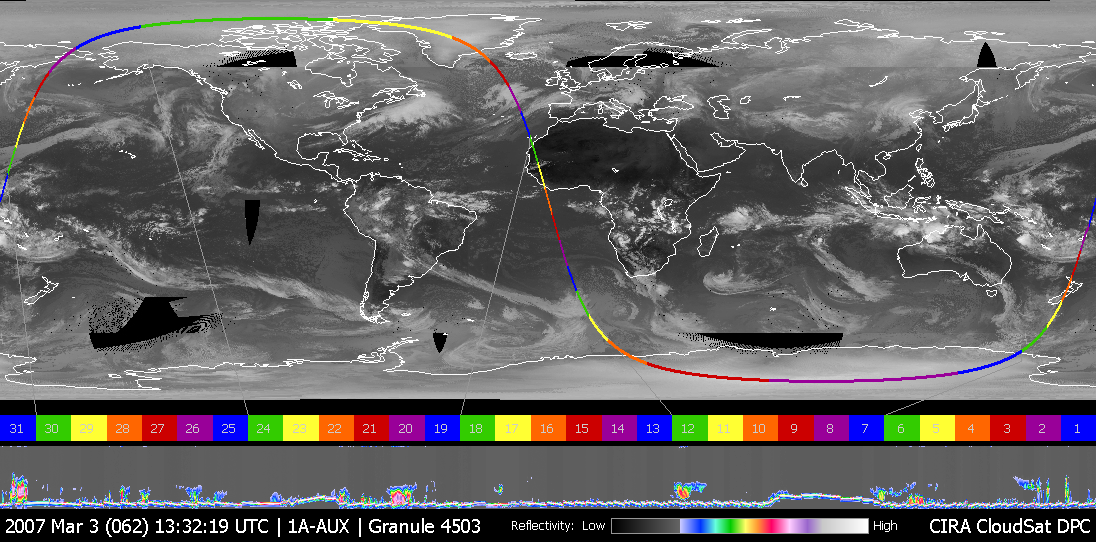
Chris Galli and Jay Mace of the University of Utah have developed the CloudSat/MODIS Joint Atmosphere Map Browser (listed in the Quick Links as "Google Maps CloudSat Browser"), which overlays CloudSat ground tracks over various MODIS cloud fields on a Google Maps map. Pop-up plots showing CloudSat profiles along the ground-track are obtained by moving the cursor along the plotted ground track. An earlier version of the tool, the CloudSat Beta Profile Browser (also in the Quick Links), shows similar combinations of CloudSat and MODIS data, but at a different scale with better coverage of high latitudes.
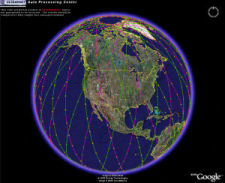
Phil Partain of the CloudSat DPC has developed experimental orbit track files designed for use with Google Earth; these are available at the DPC Google Earth Resources page, which is included in the Quick Links. Tracks files are available at both 2-minute and 5-second resolutions, together with other files showing the CloudSat calibration region boxes and the tracking stations that downlink CloudSat data.
The QuickLook page at the DPC (in the Quick Links) has received a number of updates to make it more informative and easier to use. Information has been added to each granule listing that indicates if there are missing profiles, if the transmitter was not operating, or if a calibration maneuver was performed. These conditions are flagged with a colored box. Clicking on the box will pop-up a window with more details. The page navigation pull-down menu now includes the granule number and date/time for the first granule on each page, making it much easier to jump directly to a page containing a granule you might be interested in. Finally, the quicklook page has been optimized so it should load much faster than it did in the past.
26 January 2007
CloudSat Standard Data Products Released to Science Community
The CloudSat Data Processing Center (DPC) has released a Beta version of the final 3 Standard Data Products (2B-CWC-RO, 2B-TAU, 2B-FLXHR). These data are now available to the general science community. (The above image is ice water content from 2B-CWC-RO on 15 Oct 2006.)
It is important for all users to note that these three products, as well as all of the CloudSat Standard Products in release 03 (identified in the filename as "_R03_" ) are provisional products that are still undergoing validation by the CloudSat Science Team. These products will be superseded by Release 04 on/about July 2007 and will, at that time, address known issues and other findings from the results of ongoing validation efforts during the remainder of our first year of data collection. In particular, the CWC, TAU, and FLXHR products are only released at this time for the period of 15 Oct-15 Nov 2006 to allow the science community to become familiar with them and to do their own quantitative assessment of these initial CloudSat products.
All data users are asked to review the known issues page of the Data Processing Center website and become familiar with these issues before using the results in publications or presentations. In addition, please report any additional anomalies or questions to the DPC via email or the contact page.
Other resources:
|
|


