CloudSat overpassed Hurricane Sandy on October 29, 2012 @ approximately 1825 UTC just as Sandy was approaching the mid-Atlantic coast line. Sandy contained estimated maximum sustained winds of 90 mph with a minimum pressure of 940 mb.
The CloudSat cloud profiling radar (CPR) flying in formation with A-TRAIN constellation of satellites, provides detailed observations of clouds including the vertical distribution of precipitation and cloud structure. At the expense of horizontal resolution, CloudSat provides superb vertical details of clouds and precipitation starting at the surface to 30 km in the atmosphere sampling every 250 m in height for 125 bins of vertical measurements. CloudSat provides x-ray like images of the clouds and distinguishes the amount and type of water (liquid or ice) found throughout these cloud systems.
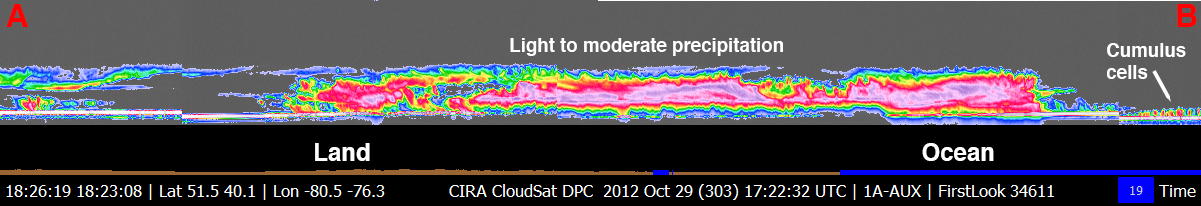
CloudSat overpassed an estimated 220 km to the west of Sandy's storm center which at the time of the overpass was still over the Atlantic Ocean. CloudSat overpassed a wide area of moderate precipitation stretching across New York to coastal North Carolina. Maximum cloud top heights from the CloudSat overpass are estimated at 12-13 km in height. The brighter colors (orange, red and light pinks) represent greater intensity of the radar signal called the return echo value. These brighter colors correlate to larger rain drops, heavier precipitation and ice or hail depending on the vertical level. The shades of blues and greens in the CloudSat return echo values represent smaller water and ice particles that correspond to thinner clouds type (cirrus and anvil tops). A nearly continuous area of light and moderate precipitation stretches across the mid-Atlantic region. Near the surface of these areas of light to moderate precipitation the CloudSat cloud profiling radar dampens (attenuates) due to larger sized water droplets and moderate areas of precipitation associated with wind.
Part of the CloudSat overpass over the ocean just off the coast of Virginia and North Carolina (denoted by blue line underneath the return echo values) reveals small pockets of shallow closed cell cumulus clouds less than 2 km in height.
An animation containing GOES satellite imagery with CloudSat imagery overlaid is shown in Figure 3 (courtesy Shigeru Suzuki of JPL). NASA Earth Observatory also posted a story of the CloudSat overpass of Hurricane Sandy.
Figure 1. MODIS IR imagery (courtesy NOAA LAADS Web).
Figure 2. CloudSat overpass track (courtesy CloudSat Data Processing Center).