Thunderstorms erupted over the gulf coastal areas of Texas and Louisiana on April 16, 2012 (1954 UTC) just ahead of an approaching cold front. Cooler air intercepting a relatively moist, unstable airmass provided the ingredients for an afternoon of thunderstorms and severe weather. Dewpoint's ahead of the cold front were in the low 70's F around the Texas Gulf coast (18Z Surface Analysis 4/16/12) whereas behind the cold front, dewpoints are in the low 40's in west Texas.
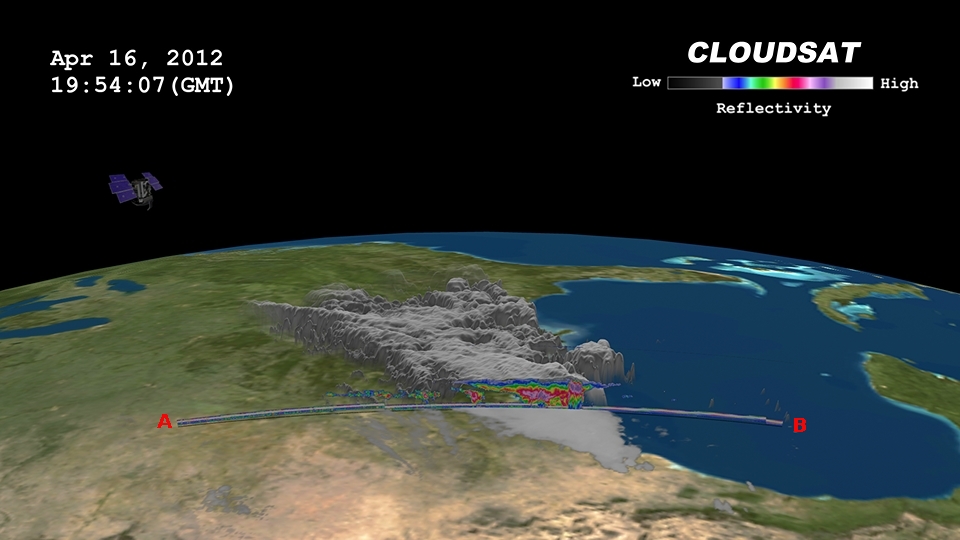
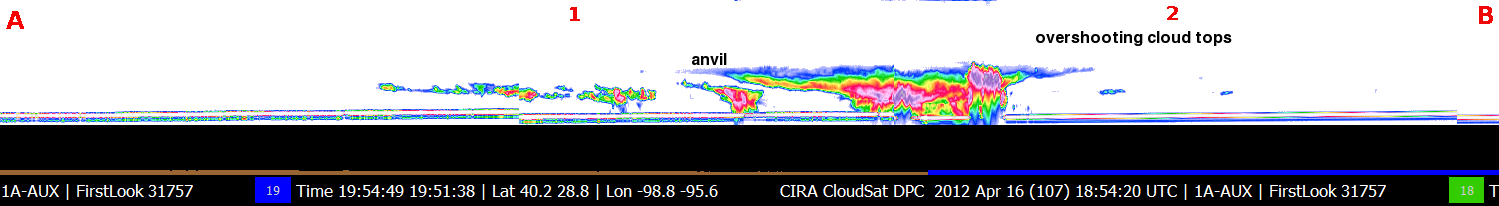
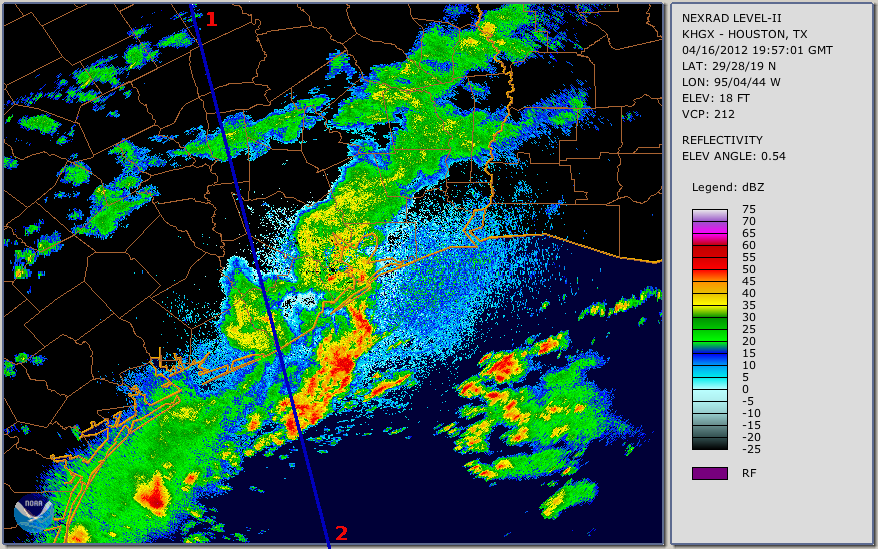
CloudSat overpassed just as the thunderstorms's started firing over the coastal region. The overshooting clouds top in Figure 2 (over the ocean) depict the intense precipitation and strong updrafts attenuating the radar signal as the storm intensifies. The anvil of the storm stretchs NW over inland areas of Texas near Galveston. The NEXRAD imagery (Figure 3, CloudSat track is in blue) shows CloudSat's observations over the deeper red and orange colored convection cells. The overshooting cloud tops in the CloudSat imagery matches the red and orange NEXRAD reflectivity containing the deeper convection.
The satellite imagery animation (Figure 4) shows the cold front pushing SE with thunderstorms building ahead of it and the area that CloudSat observes.
Figure 1. CloudSat track through GOES imagery (courtesy JPL).
Figure 2. CloudSat cross section.
Figure 3. NEXRAD Level II imagery - Galveston, TX. CloudSat track is the blue line. Numbering corresponds to positions in Figure 2.
Gulf Thunderstorm - April 16, 2012
Figure 4. GOES satellite imagery animation with CloudSat intersection.


