|
News: Typhoon Neoguri
|
 |
|
Typhoon Neoguri
CloudSat overpassed Typhoon Neoguri in the West Pacific on July 5, 2014 at 0426 UTC, the storm contained estimated maximum strength winds of 110 knots (127 mph) and minimum pressure of 942 hPa.
The Moderate Resolution Imaging Spectroradiometer (MODIS) on NASA's Aqua satellite captured the infrared (IR) image taken a few minutes before the CloudSat overpass (the blue line A-> B on Figures 1, 2 and 3). CloudSat overpassed the western edge of the center of the storm revealing a portion of eye and eye wall structure. The eye is overlaid with a cirrus canopy with a small area of cumulus and stratocumulus towards the surface. Typhoon Neoguri has a notably large eye with inner eye meso vorticies (small scale rotational areas usually found in an intensifying tropical cyclone as was the case with Neoguri). CloudSat intesected a wide swath of the storm from the NW to SE cutting through the center of the storm. CloudSat reveals the wide area of moderate to heavy convection south of the eye in the areas of the eyewall and outer bands. The cirrus canopy extends hundreds of km's outward from the storm revealing the extensive size (towards the 'B' in Figure 4).
McIDAS-X imagery (4 km remapped and color enhanced 11 um infrared imagery (IR)) from MSTAT is shown in Figure 2 and reveals the cold cloud tops (-70 to -80 C degree range with red and yellow color enhancement, respectively).
McIDAS-X imagery (1 km remapped and color enhanced 11 um infrared imagery (IR)) from MSTAT is shown in Figure 3 and reveals the cold cloud tops (-70 to -80 C degree range with red and yellow color enhancement, respectively).

Figure 1. MODIS imagery of Typhoon Neoguri.
| 
Figure 2. 4 km Remapped Color Enhanced Infrared Imagery (courtesy RAMMB). Image taken at 0432 UTC
| 
Figure 3. 1 km Remapped Color Enhanced Infrared Imagery (courtesy RAMMB). Image taken at 0425 UTC.
| 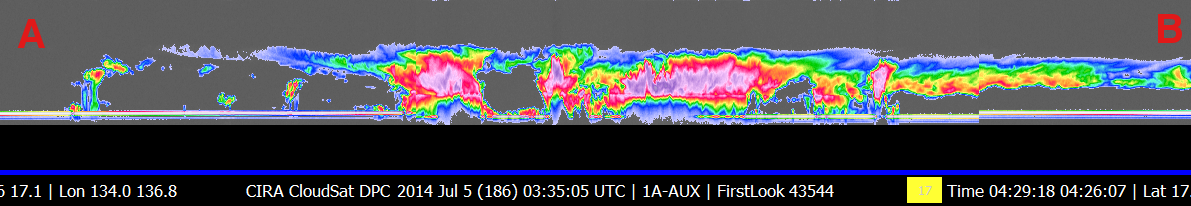
Figure 4. CloudSat overpass.
|
References:
MODIS imagery, LAADS Web, Retrieved July 7, 2014.
4km Remapped Color Enhanced Infrared Imagery, Typhoon Neoguri, Retrieved July 7, 2014.
CloudSat Data Processing Center, Retrieved July 7, 2014.
NRL Tropical Cyclone Page, Typhoon Neoguri, Retrieved July 7, 2014.
Last Updated: Natalie D. Tourville, Cooperative Institute for Research in the Atmosphere, July 7, 2014. Contact information: Natalie.Tourville@colostate.edu
|


