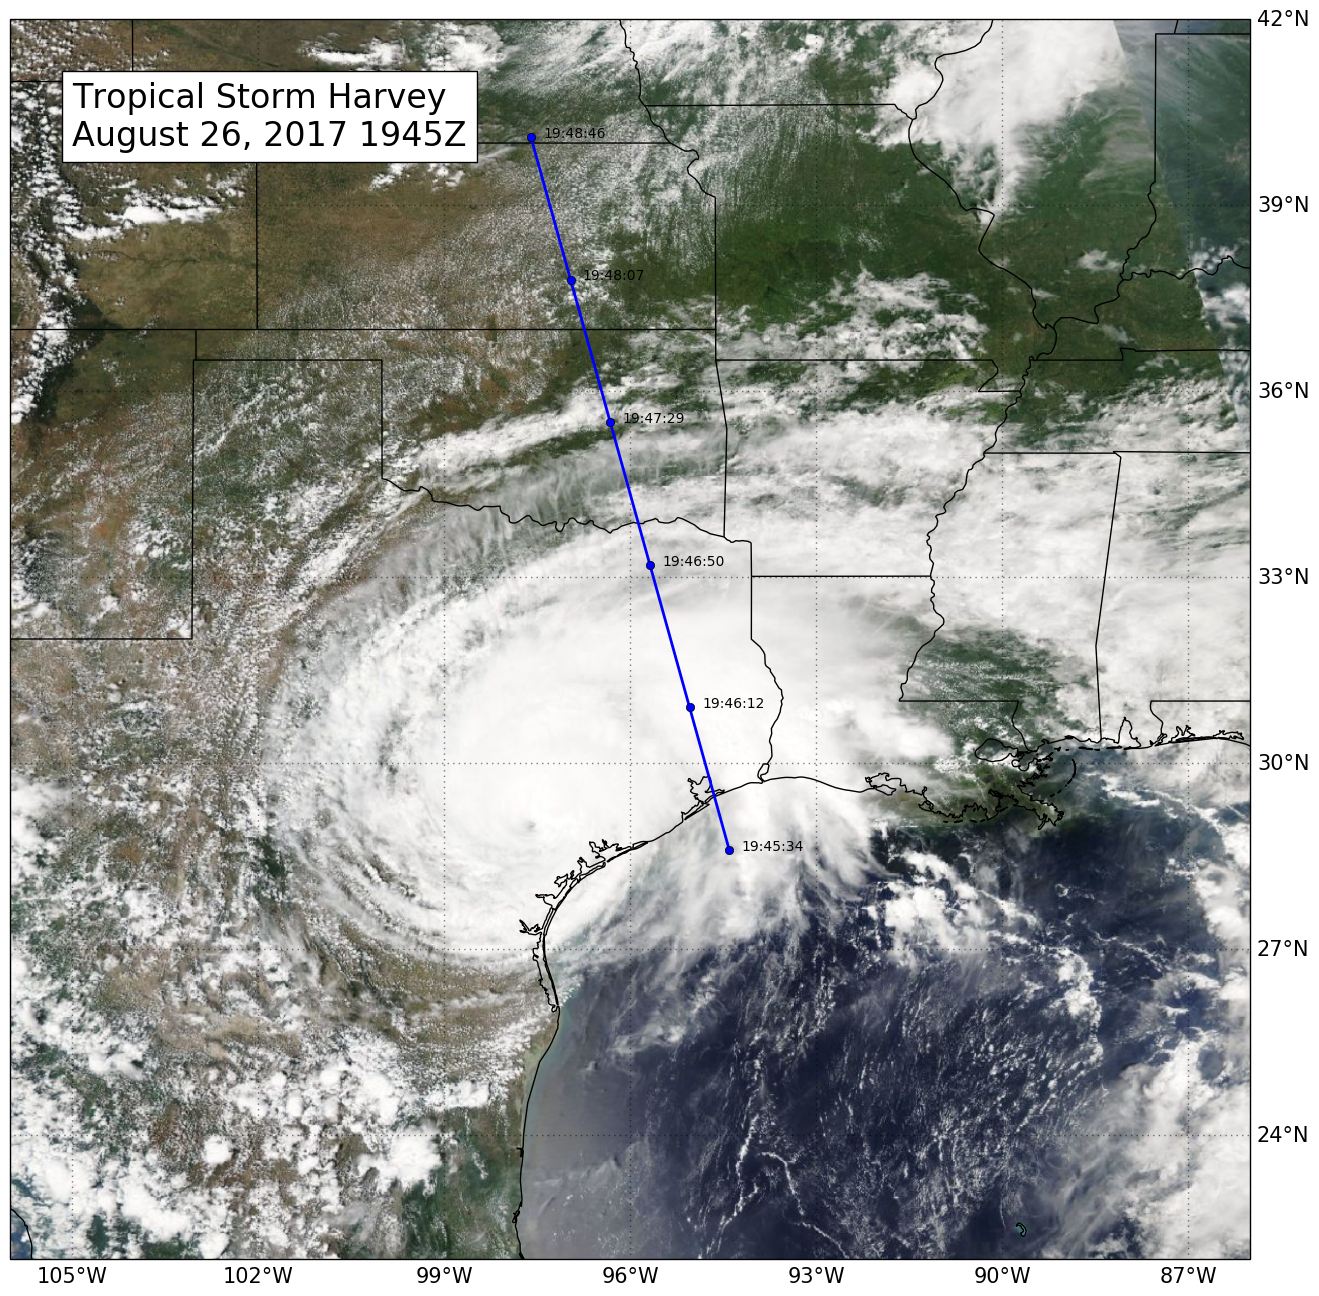
CloudSat overpassed Tropical Storm Harvey on August 26, 2017 @ 1945 UTC as the storm was nearly stationary over south Texas. Tropical Storm Harvey contained estimated sustained winds of 60 knots (69 mph).
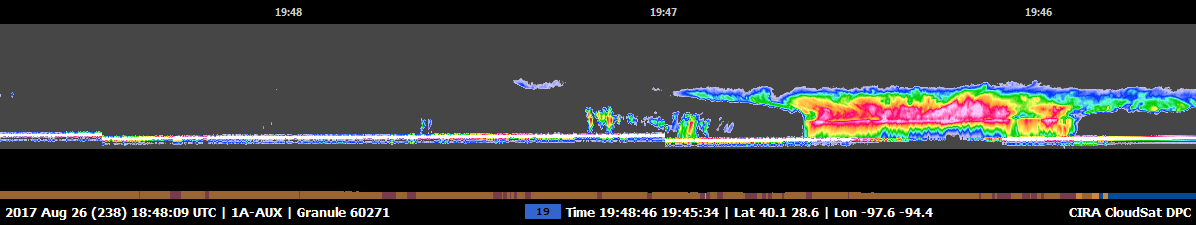
CloudSat overpassed northeast of the storm center through an area of moderate to heavy rainfall in the outer rainbands. Large amounts of liquid and ice water (denoted by the red and pink colors) are found beneath the cloud tops. The lack of signal (attenuation) beneath the melting layer (around 5 km in height) can be seen in the heavier areas of precipitation as CloudSat’s cloud profiling radar (CPR) signal dampens when particles are larger than 3 mm in size. Smaller cumulus and cumulonimbus cloud types are detected north of the area of moderate to heavy precipitation. The cirrus canopy (anvil) extends outwards from the storm system (blue and green colors).
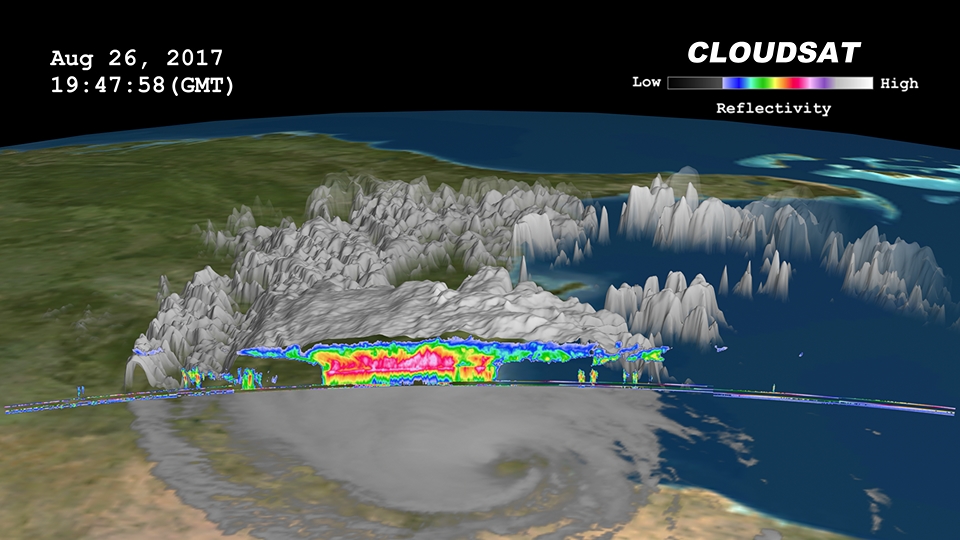
The Moderate Resolution Imaging Spectroradiometer (MODIS) on NASA's Aqua satellite captured the infrared (IR) image taken a few minutes before the CloudSat overpass (the blue line on Figure 1). Figure 2 depicts the CloudSat 1B-CPR imagery of the overpass. Figure 3 is a time lapsed animation combining GOES imagery and the CloudSat overpass. Figure 4 merges GOES and CloudSat imagery into a 2D image.
Figure 1. MODIS imagery with CloudSat track and UTC time (blue line) of Hurricane Harvey.
Figure 2. CloudSat 1B-CPR imagery of Hurricane Harvey.