CloudSat overpassed Tropical Storm Debby in the Gulf of Mexico on June 24, 2012 at 1900 UTC (1500 EDT). CloudSat overpassed just to the east of the storm center, intersecting the north and southeast portions of the fragmented storm system.
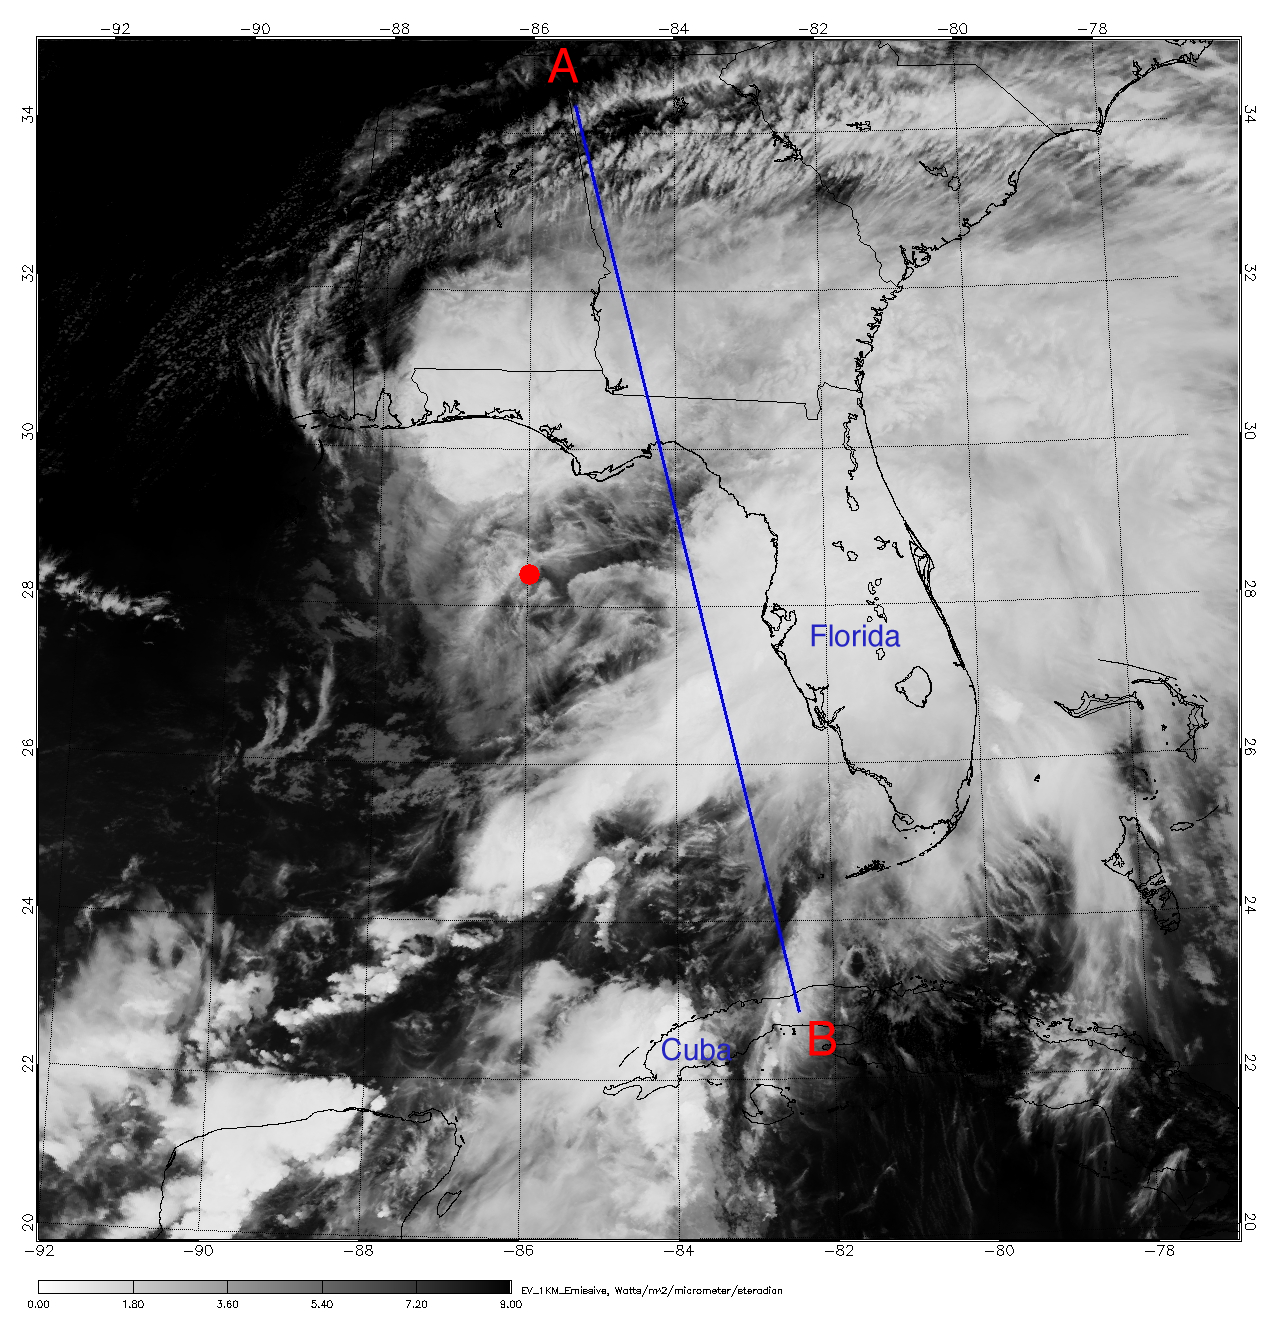
The Moderate Resolution Imaging Spectroradiometer (MODIS) on NASA's Aqua satellite captured the infrared (IR) (Figure 1) image taken a few minutes before the CloudSat overpass (Figure 2) denote by the blue line A->B). The 4km Remapped Color Enhanced Infrared Imagery, Figure 3, also shows the CloudSat track during the same time period. This imagery distinguishes between cold and warm cloud top temperatures using IR imagery (higher cloud tops -> colder temperatures).
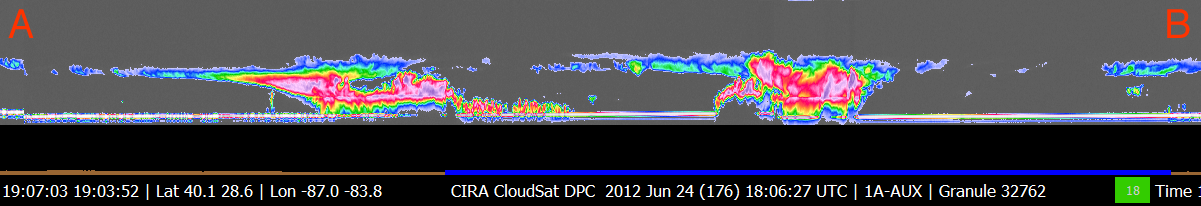
Tropical Storm Debby was moving very slowly northeast (NE) towards Florida. Most of the tropical convection associated with this system was located to the north and east of the storm center (red dot on MODIS imagery). CloudSat overpasses both of the convective cores around the storm. The CloudSat overpass of the northern convective core reveals the anvil cloud top stretching north with a mixture of moderate to heavy precipitation near the coast with pockets of cumulus cells around 4-5 km in height extending out over the Gulf of Mexico.
The CloudSat overpass of the southern convective cell shows taller cloud tops with heavier precipitation (lack of radar signal at lower levels, less than 5 km). The 4km Remapped Color Enhanced Infrared Imagery reveals CloudSat overpassed the edge of stronger and deeper convective core with cold cloud tops (denoted by the red areas) corresponding with the CloudSat attenuation and heavy precipitaiton area. Moderate to light precipitation extends further south along the CloudSat track with an area of cirrus, altocumulus and small cumulus cells over Cuba.
An animation containing GOES satellite imagery with CloudSat imagery overlaid is shown in Figure 4 (courtesy Shigeru Suzuki of JPL).
Figure 1. MODIS IR imagery (courtesy NOAA LAADS Web).
Figure 2. CloudSat overpass track (courtesy CloudSat Data Processing Center).
Figure 3. 4km Remapped Color Enhanced Infrared Imagery (courtesy RAMMB).
Figure 4. Tropical Storm Debby Animation - Gulf of Mexico, June 24, 2012.