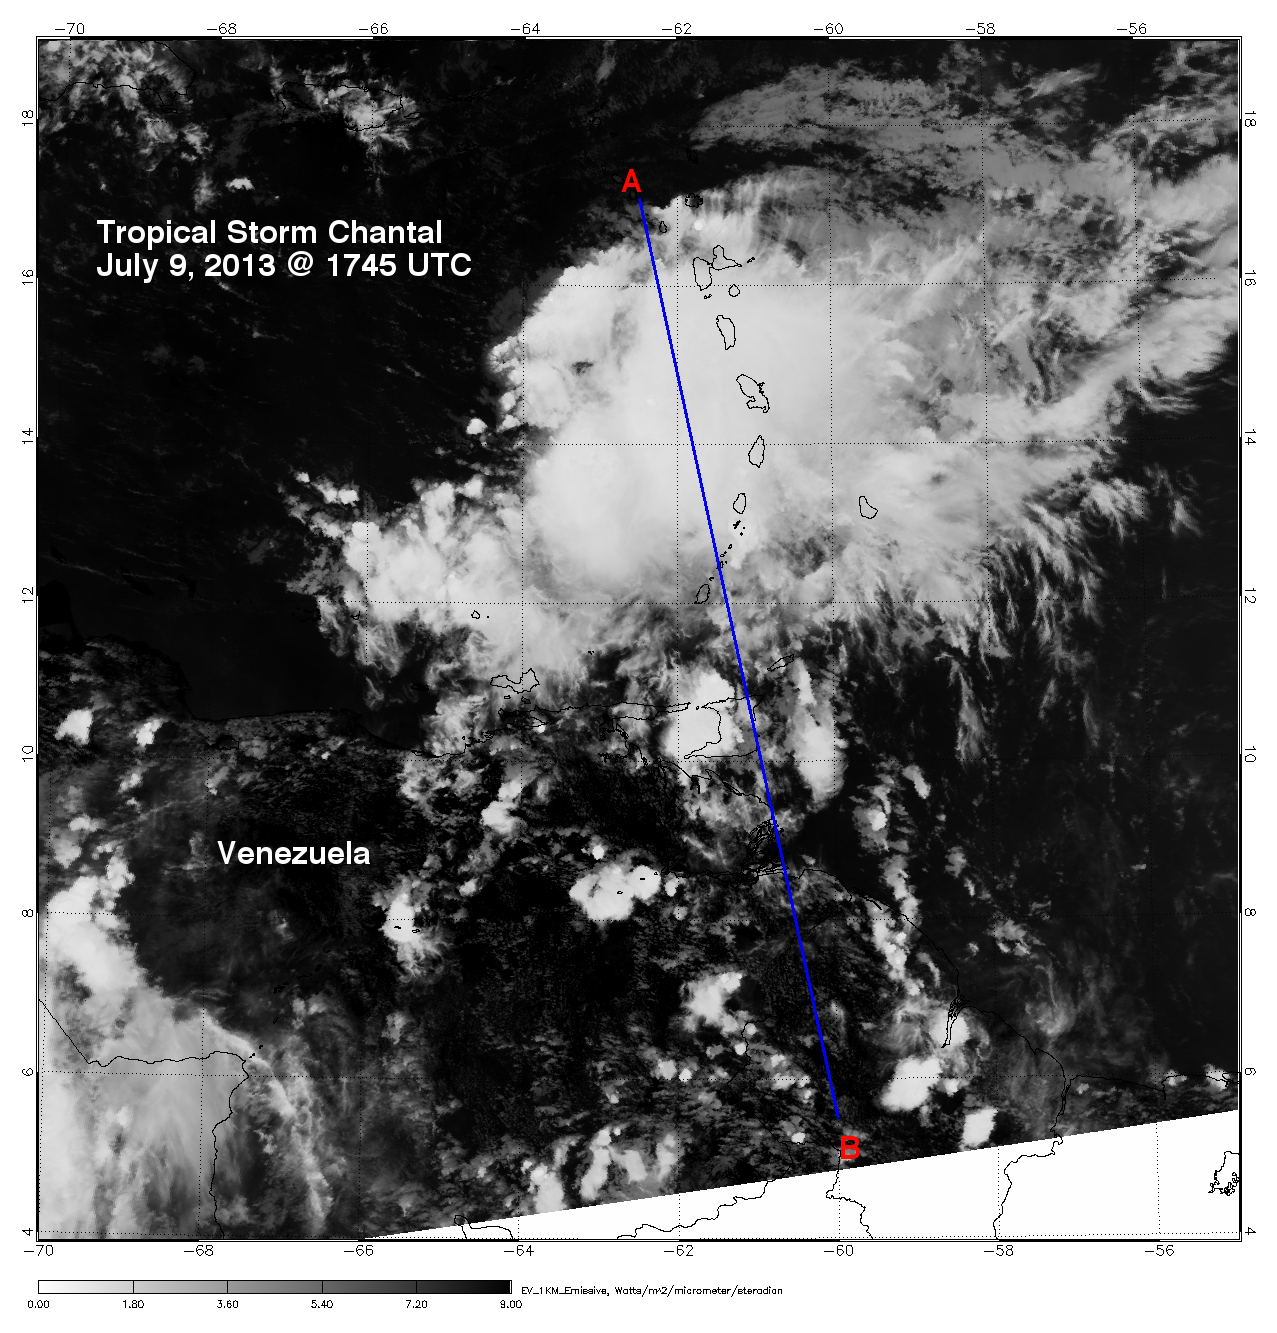
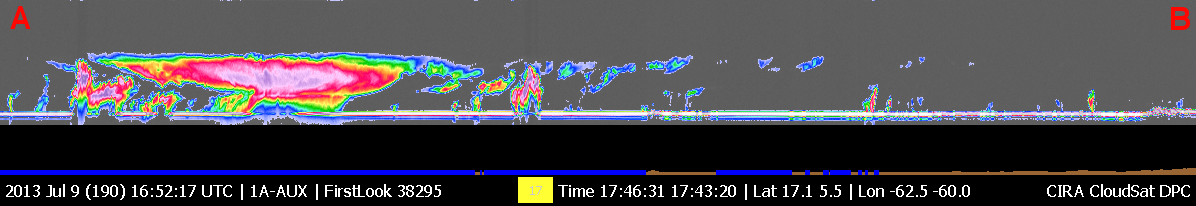
CloudSat overpassed Tropical Storm Chantal on July 9, 2013 at 1745 UTC. Maximum strength winds at the time of the overpass were 55 knots with minimum pressure of 1006 mb.
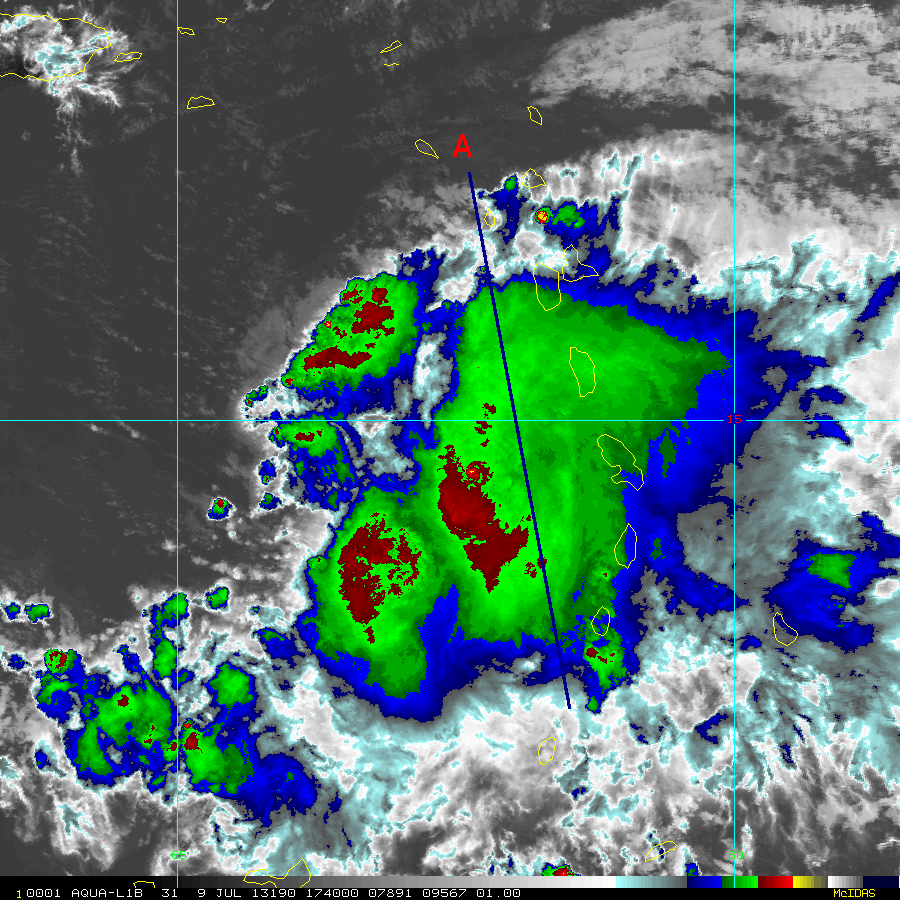
The Moderate Resolution Imaging Spectroradiometer (MODIS) on NASA's Aqua satellite captured the infrared (IR) (Figure 1) image taken a few minutes before the CloudSat overpass (Figure 2) denote by the blue line A->B). The 1km Remapped Color Enhanced Infrared Imagery, Figure 3, also shows the CloudSat track during the same time period. This imagery distinguishes between cold and warm cloud top temperatures using IR imagery (higher cloud tops -> colder temperatures).
CloudSat overpassed 70 km east of the storm center through a small region of developing thunderstorms. The CloudSat overpass reveals an extensive area of mid and upper level clouds with large amounts of ice water content (deep red and pink color) in the upper troposphere. The cirrus anvil of the system extends outward over a large area to the north and south of these thunderstorms. Underneath the anvil, areas of smaller cumulus, stratus and cumulonimbus to the north are revealed. The CloudSat cloud profiling radar (CPR) excels in detecting water and ice particles under 3mm in diameter. The signal starts to attenuate (loss of signal) when water or ice particles become larger than this. An area of moderate precipitation is evident in the CloudSat overpass by the lack of signal near the ocean surface (where the radar return color changes to blue and green). The melting layer (where water changes from frozen to liquid form) is also evident in this overpass around 5-6km as a single line above the moderate precipitation area.
An animation containing GOES satellite imagery with CloudSat imagery overlaid is shown in Figure 4 (courtesy Shigeru Suzuki of JPL).
Figure 1. MODIS IR imagery (courtesy NOAA LAADS Web).
Figure 2. CloudSat overpass track (courtesy CloudSat Data Processing Center).
Figure 3. 1km Remapped Color Enhanced Infrared Imagery (courtesy RAMMB).
Figure 4. Tropical Storm Chantal Animation - July 9, 2013.