|
News: April 2011 Severe Weather
|
 |
|
Severe Weather Outbreak April 2011
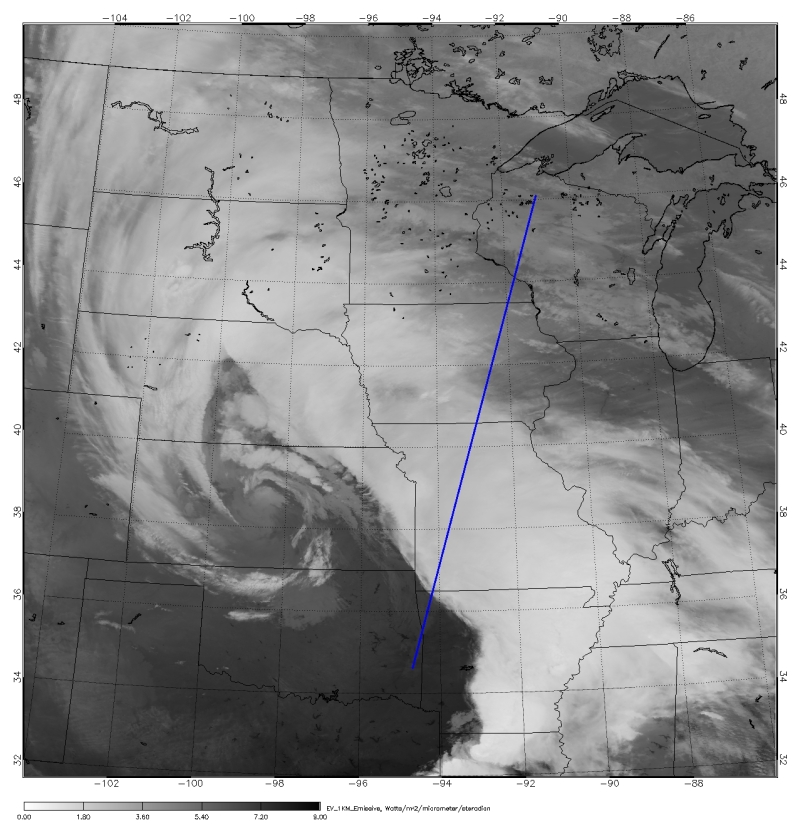
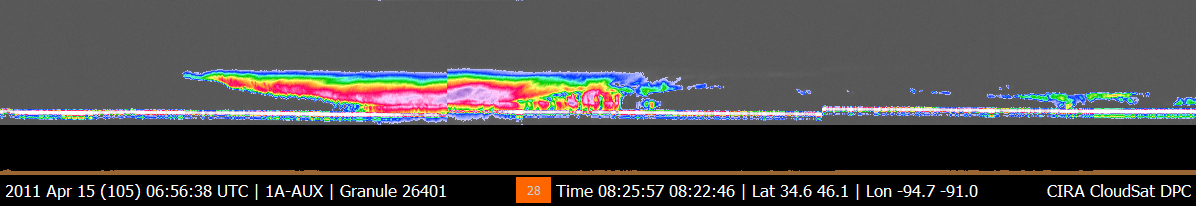
A strong extratropical storm system moved across the central United States April 14-16, 2011 spawning close to 200 tornadoes, heavy rain and strong winds. At least 42 people were killed with this particular severe weather and tornado outbreak over the three day period. CloudSat overpassed the storm system on April 15 and 16th as the system progressed eastward.
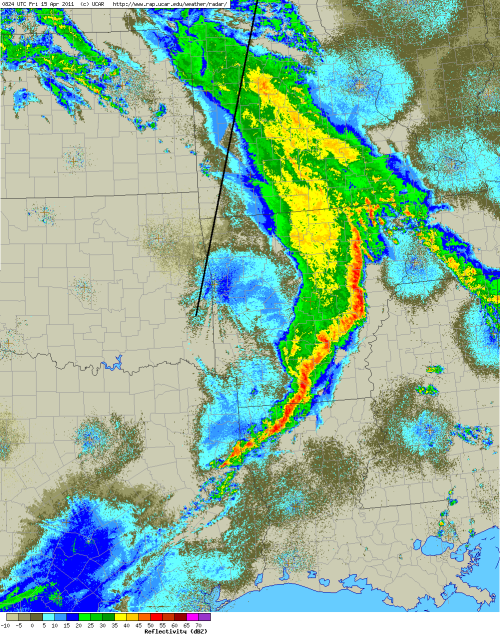
MODIS imagery on April 15th at 0830 UTC reveals the distinct comma shaped area of the low pressure system over Kansas. CloudSat overpasses the cloud mass between the warm front and cold front boundary (NOAA Surface Analysis image @0900 UTC) as it becomes an occluded front. An occluded front forms when the cold front rotates around the low pressure system and catches up with the warm front. Light to moderate precipitation is falling in this area from a mixture of stratus and cumulus clouds. A long line of severe weather and strong thunderstorms follows the cold front boundary through Arkansas and northern Louisiana.
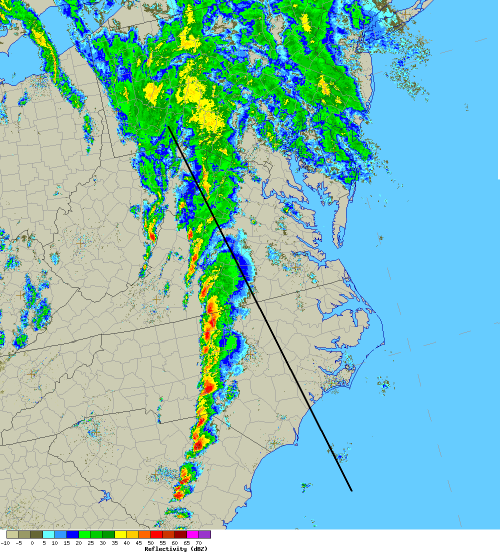
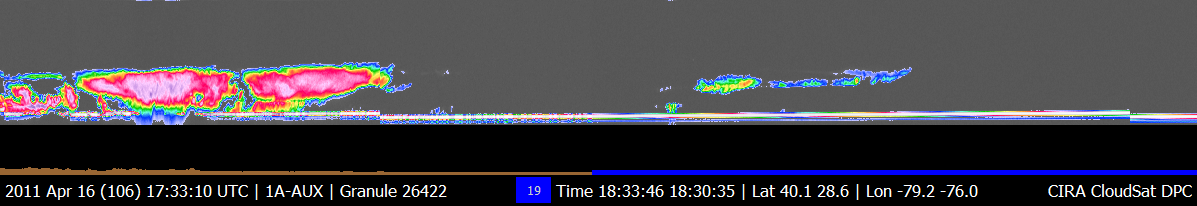
On April 16, 2011 at 1830 UTC, CloudSat overpassed the severe thunderstorms that produced many of the tornadoes that struck areas of North Carolina and Virginia. CloudSat passed just to the east of these developing thunderstorms. CloudSat vertical profiles reveal the wide area of mid-level moisture from the spreading out of the thunderstorms. CloudSat reveals areas of cirrus, cumulus and cumulonimbus cloud types throughout the cross section.
Sources:
Radar imagery courtesy of RAP.
MODIS imagery courtesy of LAADS Web.
Surface analysis courtesy of NOAA.
Created and edited by Natalie Tourville, April 27, 2011.
|